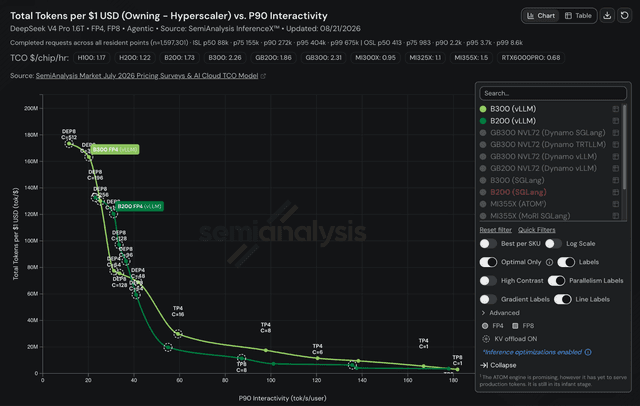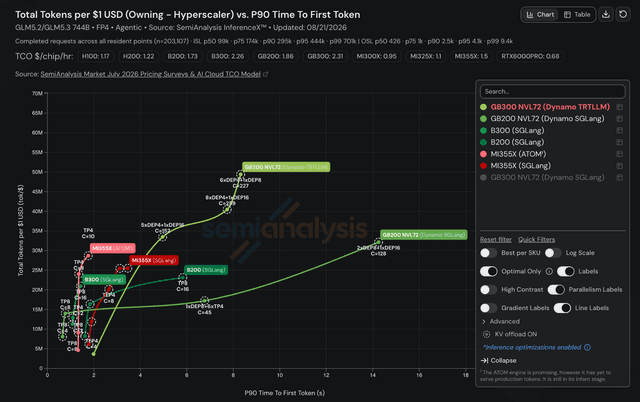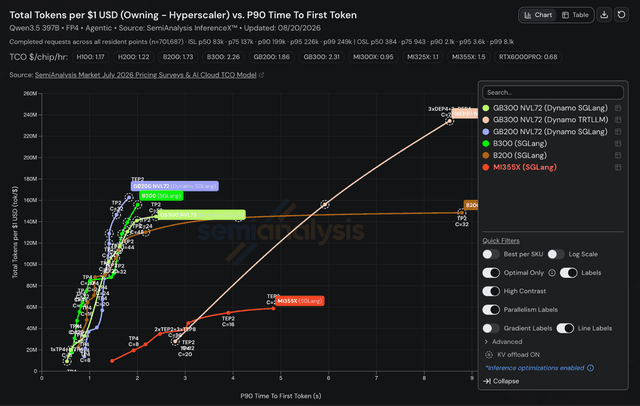
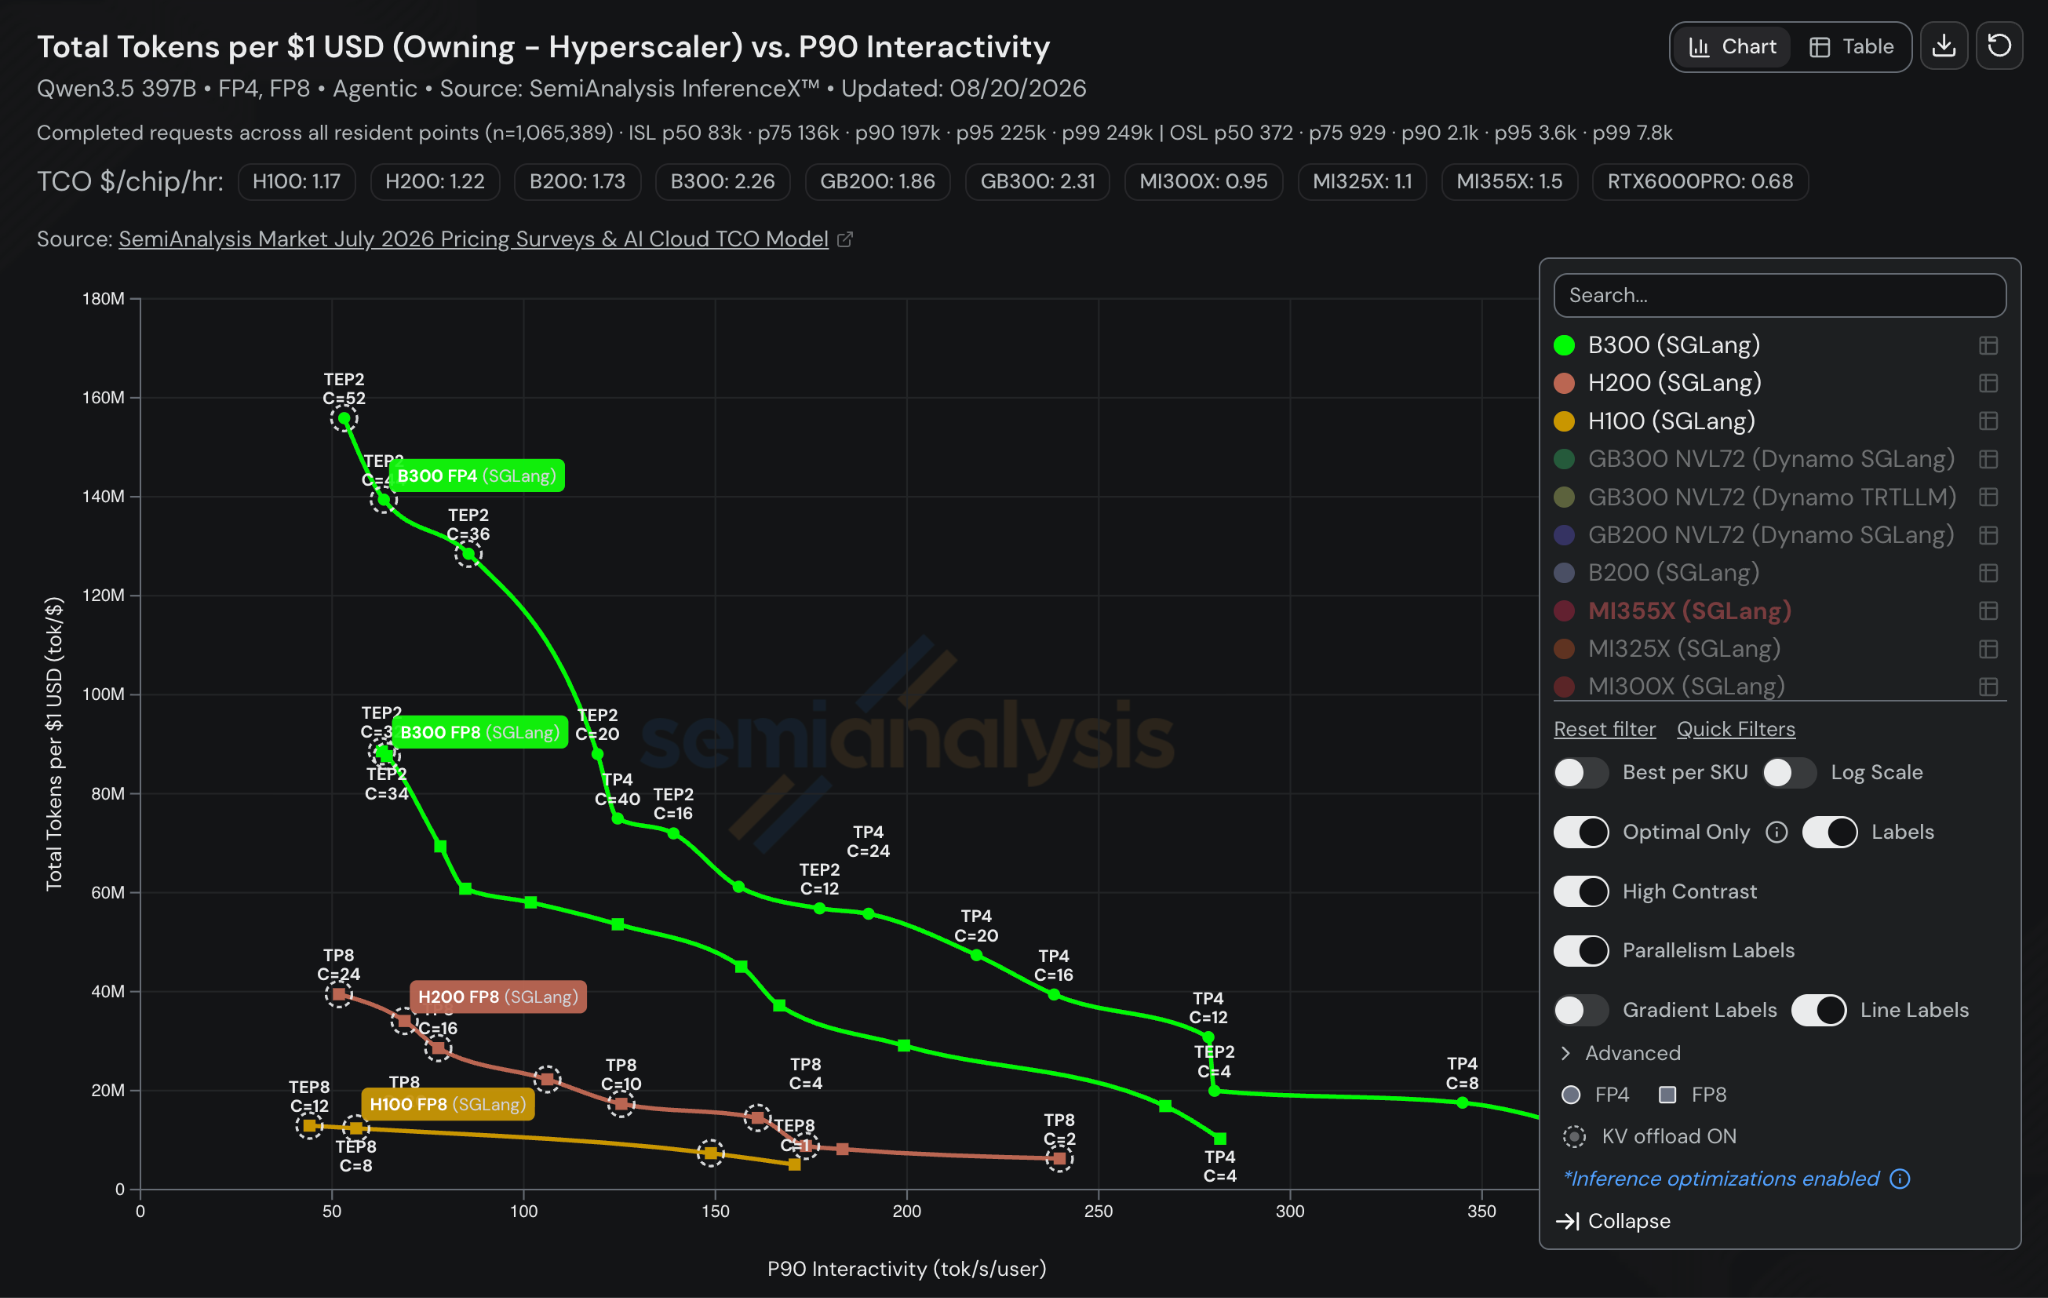
Compared to H100, on Qwen3.5, B300 FP4 has 12x better performance per dollar.
What the number is and is not
Two things are changing at once here, and both belong in the reading. The first is four years of hardware. The second is numerical format: the comparison spans FP4 and FP8 rather than holding precision constant, which is the honest way to compare what an operator can actually deploy today on each part, but not a controlled study of the silicon alone.
The workload matters as much. This is not 8k1k. Qwen3.5 has a native max context length of 262k tokens, so AgentX replays the truncated 256k agentic dataset against it, which means frequent context compaction and heavy prefix reuse. A ratio measured on a long-context multi-turn replay is a different claim from the same ratio measured on independent short prompts, and it is the one closer to production coding traffic.
Read it at your own operating point
A 12x aggregate ratio is a headline, not a deployment plan. The curve is what carries the decision: pick the interactivity your product needs, read each system there, and check the first-token latency at the same point before concluding anything.
That is also why the per-model AgentX charts default to showing the whole frontier rather than a single number. Older hardware can remain competitive at low concurrency on performance per dollar while falling away entirely at high throughput, and a single ratio cannot express both halves of that shape.
These results are one slice of AgentX 1.0. The full analysis, the replay methodology, and the 70+ upstream PRs the benchmark drove are in AgentX - InferenceXv3: Does the CUDA Moat Hold Up in Agentic Inferencing?. Every point is explorable on the free dashboard.
All articles and posts are © SemiAnalysis. All rights reserved. The AGPL-3.0 license covering the application source code does not apply to article content.