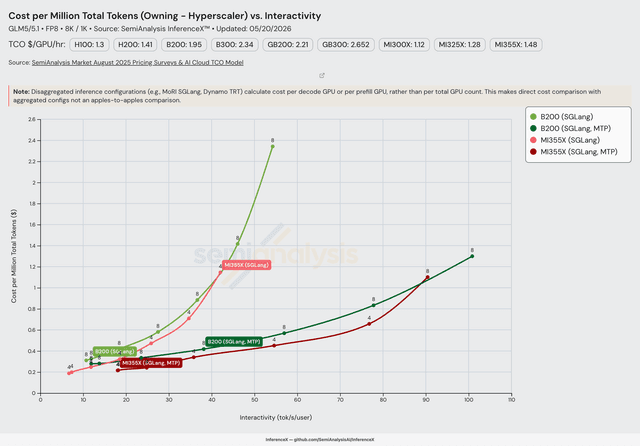
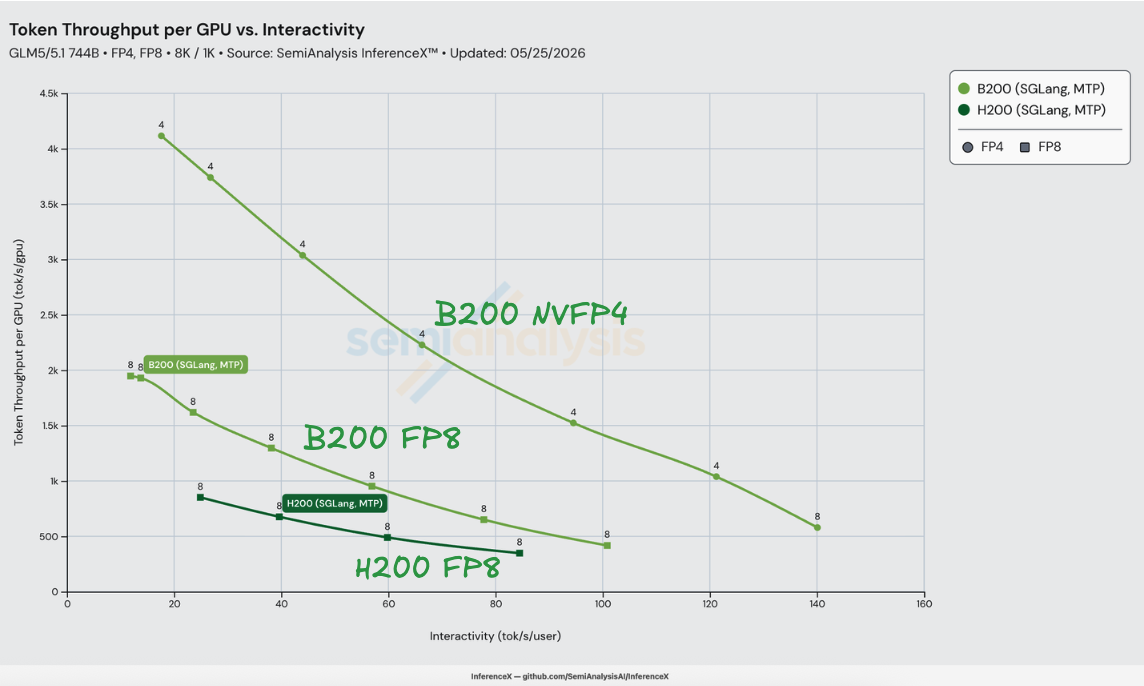
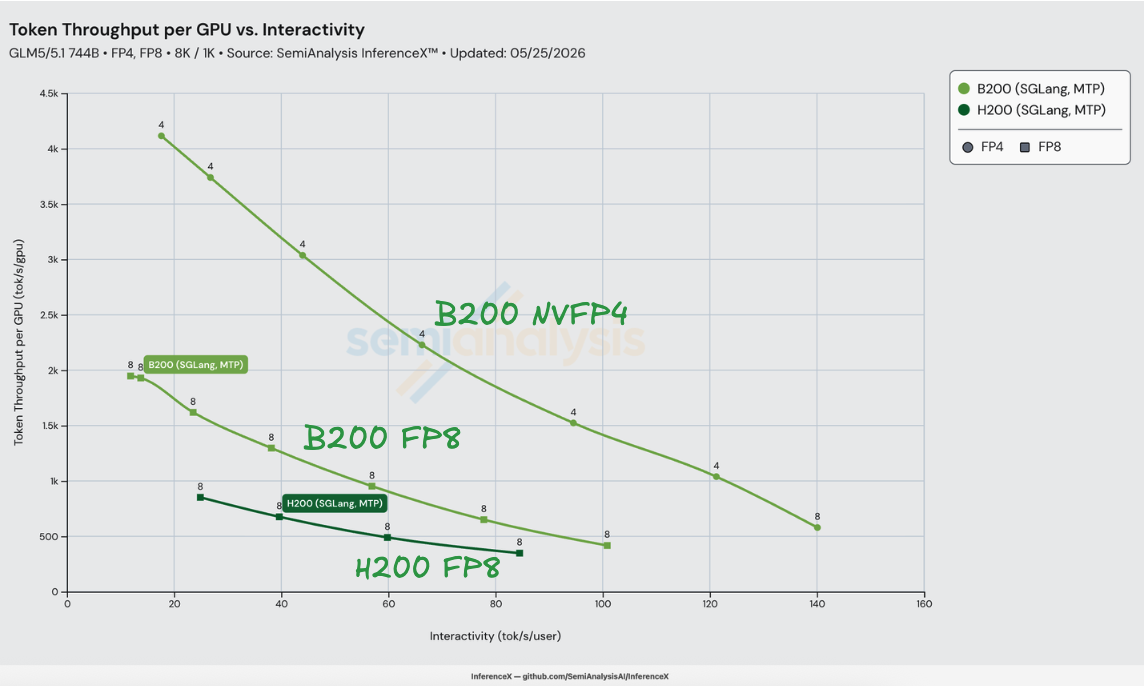
On GLM-5 8K/1K with both H200 and B200 running SGLang, NVIDIA's GLM-5-NVFP4 checkpoint on B200 delivers up to 3.65x better performance per dollar than H200 SGLang FP8 at iso-interactivity — H200 at $1.06/M tokens vs B200 NVFP4 at $0.29/M tokens at 80 tok/s/user. The lift stays in a 3.24x–3.65x band across H200's full 25–84 tok/s/user operating range. Measured on InferenceX as of 2026-05-25 on SGLang v0.5.12.
The 3.65x factors cleanly at the peak. At 80 tok/s/user, B200 SGLang FP8 + MTP delivers 1.22x better performance per dollar than H200 SGLang FP8 + MTP — the Blackwell generation + software step alone, with the same precision and the same EAGLE recipe on both sides. Swapping the B200 weights from zai-org/GLM-5-FP8 to nvidia/GLM-5-NVFP4 stacks another 2.98x — the precision step alone, riding on FlashInfer's TRT-LLM sparse MLA kernels that landed as the default on sm100/sm103 in sgl-project/sglang #21783. 1.22 × 2.98 ≈ 3.65. The two steps trade places across the band — generation contributes more at low interactivity (1.36x at 50 tok/s/user) and precision contributes more at high (3.07x at 84 tok/s/user) — but the combined lift is steady.
GLM-5 is ZAI's (Zhipu) MoE flagship, released 2026-02-11 — roughly 14 weeks before this run. It's a 744B-parameter sparse MoE with ~40B activated per token: 256 experts with top-8 routing (~5.9% sparsity) plus shared experts, DeepSeek Sparse Attention (DSA) on decode paired with Multi-head Latent Attention (MLA) for KV-cache compression, and a 200K context window. The published architecture name is glm_moe_dsa — the same sparse-attention pattern DeepSeek introduced in V3.2 and that SGLang's TRT-LLM sparse MLA backend on Blackwell was tuned around.
NVIDIA additionally published a quantized weights release at nvidia/GLM-5-NVFP4 — the same model architecture as zai-org/GLM-5-FP8, with all MoE GEMM weights re-cast from FP8 to NVFP4 (16-element blocks, FP8 per-block scales, FP32 per-tensor scale). The KV cache stays FP8. This is the checkpoint the B200 line in the chart loads; the H200 line loads zai-org/GLM-5-FP8 because Hopper has no FP4 tensor cores.
On-Paper Specs
Before the recipes, the hardware. H200 SXM (Hopper) and B200 SXM (Blackwell) sit one generation apart. The radar below normalizes each axis to the maximum across every NVIDIA + AMD SKU in /gpu-specs — so the visible H200 and B200 polygons compress against axes where GB200/GB300 NVL72 set the ceiling (notably scale-up domain memory and scale-up domain memory bandwidth, which scale with the rack-scale 72-GPU NVLink domain).
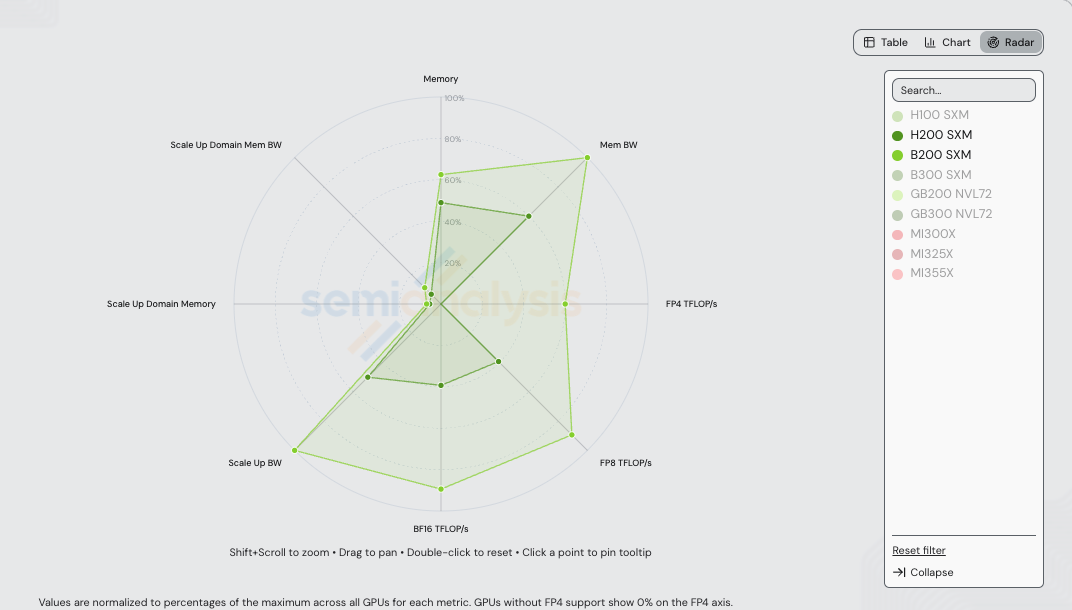
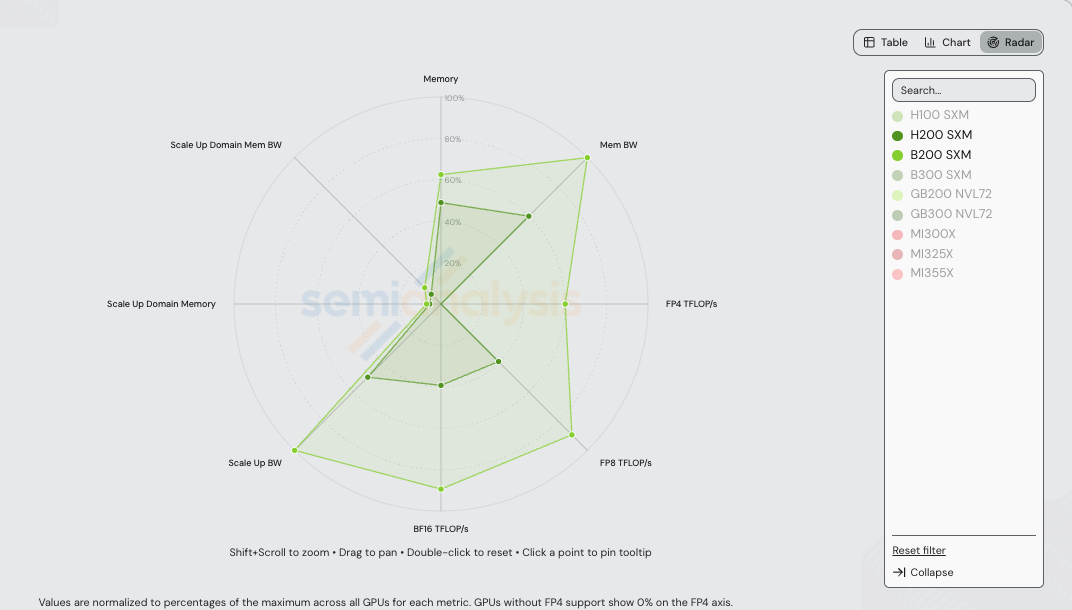
Absolute values for the two SKUs in this benchmark:
| Spec | H200 SXM | B200 SXM | B200 / H200 |
|---|---|---|---|
| HBM capacity | 141 GB (HBM3e) | 180 GB (HBM3e) | 1.28x |
| HBM bandwidth | 4.8 TB/s | 8.0 TB/s | 1.67x |
| Dense FP4 (TFLOP/s) | — | 9,000 | — |
| Dense FP8 (TFLOP/s) | 1,979 | 4,500 | 2.27x |
| Dense BF16 (TFLOP/s) | 989 | 2,250 | 2.28x |
| Scale-up BW per GPU (uni-di) | 450 GB/s (NVLink 4) | 900 GB/s (NVLink 5) | 2.00x |
| Scale-up world size | 8 | 8 | 1.00x |
| Scale-up domain HBM capacity | 1,128 GB | 1,440 GB | 1.28x |
| Scale-up domain HBM BW (aggregate) | 38.4 TB/s | 64.0 TB/s | 1.67x |
| TCO (SemiAnalysis AI Cloud Model) | $1.41/GPU/hr | $1.95/GPU/hr | 1.38x |
The implication for an FP8-vs-FP8 comparison: with the same precision and the same recipe, B200's perf/$ ceiling vs H200 is bounded by 2.27 / 1.38 ≈ 1.64x on a fully compute-bound workload and by 1.67 / 1.38 ≈ 1.21x on a fully memory-bandwidth-bound workload (using HBM as the bandwidth axis; NVLink BW would push the bound up to 2.00 / 1.38 ≈ 1.45x). The measured 1.22x at 80 tok/s/user lands inside the memory-bandwidth bracket — GLM-5 decode at this concurrency is dominated by HBM reads of MoE weights and KV-cache, not FP8 GEMM throughput, so the dense compute headroom on Blackwell mostly stays on the table. NVFP4 is the lever that breaks the GEMM ceiling: H200 has zero FP4 tensor cores, B200 has 9 PFLOP/s, and the resulting precision step compounds 2.41x–3.07x on top of the generation step.
What Shipped to Make This Happen
Upstream stack. SGLang v0.5.10 (2026-04-07) was the first stable release where GLM-5 ran end-to-end on Blackwell across all four precision/MTP/disagg variants — the tracking issue #19380 flipped every Functional and Baseline Perf row to DONE the same day. The benchmark in this post runs v0.5.12 (released 2026-05-16), which inherits the same Blackwell defaults plus the round-1 perf optimizations on top. The kernel changes that matter:
- sgl-project/sglang #21783 sets FlashInfer TRT-LLM sparse MLA kernels as the default attention backend on sm100/sm103 (B200/B300). DSA prefill and decode now run on the kernels GLM-5/V3.2 were tuned against, rather than the older
flashmla_kvpath that hit a GLM-5 accuracy regression on B200. - sgl-project/sglang #21405 enables IndexCache for sparse MLA, reusing index tensors across consecutive decode steps for a >10% decode throughput lift on the same kernel call sequence.
- flashinfer-ai/flashinfer #2726 (in FlashInfer v0.6.6.post1) fixed an intermittent NVFP4 illegal-memory-access bug that had been blocking the NVFP4 functional sign-off; flashinfer-ai/flashinfer #2836 (in v0.6.7) lifted the trtllm-gen sparse MLA perf ceiling.
MTP. GLM-5 reuses the EAGLE speculative-decoding plumbing SGLang built for DeepSeek V3.2 (--speculative-algorithm EAGLE --speculative-num-steps 3 --speculative-eagle-topk 1 --speculative-num-draft-tokens 4), with the overlap scheduler enabled via SGLANG_ENABLE_SPEC_V2=1. The same flag set runs on H200 and B200 — the only thing that differs across the two SKUs in the recipes below is the model checkpoint and the attention backend choice.
The Numbers
All rows are GLM-5 at ISL 8192 / OSL 1024 on a single non-disaggregated node, measured on InferenceX as of 2026-05-25 on SGLang v0.5.12 with EAGLE-based MTP enabled on every recipe. Cost per million total tokens is computed as TCO_$/GPU/hr / (3600 × tput_per_gpu / 1e6), with H200 at $1.41/GPU/hr and B200 at $1.95/GPU/hr per the SemiAnalysis AI Cloud TCO Model.
Container image: lmsysorg/sglang:v0.5.12-cu130 on both SKUs.
H200 SGLang FP8 + MTP, TP=8 on 8 GPUs (model zai-org/GLM-5-FP8):
| Conc | tok/s/GPU | tok/s/user | TPOT (ms) | $/M tokens |
|---|---|---|---|---|
| 4 | 347.9 | 84.49 | 11.84 | $1.13 |
| 8 | 489.7 | 59.82 | 16.72 | $0.80 |
| 16 | 675.9 | 39.64 | 25.22 | $0.58 |
| 32 | 851.9 | 24.90 | 40.16 | $0.46 |
| 64 | 847.2 | 20.80 | 48.08 | $0.46 |
Concurrency 64 falls back slightly on tok/s/GPU as TTFT begins to dominate the request budget — conc 32 sets the H200 throughput ceiling and the cost floor on this recipe. The Pareto frontier drops conc 64 because conc 32 dominates it in both axes.
B200 SGLang FP8 + MTP, TP=8 on 8 GPUs (model zai-org/GLM-5-FP8):
| Conc | tok/s/GPU | tok/s/user | TPOT (ms) | $/M tokens |
|---|---|---|---|---|
| 4 | 417.0 | 100.85 | 9.92 | $1.30 |
| 8 | 650.1 | 77.82 | 12.85 | $0.83 |
| 16 | 952.7 | 56.93 | 17.57 | $0.57 |
| 32 | 1,296.8 | 38.16 | 26.21 | $0.42 |
| 64 | 1,619.3 | 23.56 | 42.45 | $0.33 |
| 128 | 1,929.5 | 13.78 | 72.59 | $0.28 |
| 256 | 1,947.3 | 11.88 | 84.15 | $0.28 |
B200 SGLang NVFP4 + MTP, TP=4 on 4 GPUs (model nvidia/GLM-5-NVFP4) — the cost-frontier anchor:
| Conc | tok/s/GPU | tok/s/user | TPOT (ms) | $/M tokens |
|---|---|---|---|---|
| 4 | 1,038.7 | 121.22 | 8.25 | $0.52 |
| 8 | 1,523.5 | 94.53 | 10.58 | $0.36 |
| 16 | 2,228.1 | 66.27 | 15.09 | $0.24 |
| 32 | 3,037.3 | 43.99 | 22.73 | $0.18 |
| 64 | 3,739.7 | 26.78 | 37.33 | $0.14 |
| 128 | 4,115.5 | 17.63 | 56.73 | $0.13 |
| 256 | 4,090.7 | 17.37 | 57.57 | $0.13 |
B200 SGLang NVFP4 + MTP, TP=8 on 8 GPUs — single high-interactivity datapoint, extends the FP4 frontier right:
| Conc | tok/s/GPU | tok/s/user | TPOT (ms) | $/M tokens |
|---|---|---|---|---|
| 4 | 579.2 | 140.08 | 7.14 | $0.94 |
The TP=8 / 8 GPU configuration trades half the per-GPU throughput for a 16% interactivity lift over TP=4 at the same conc — the additional GPUs cut TPOT from 8.25 ms to 7.14 ms. The combined FP4 Pareto frontier walks from $0.13/M at 18 tok/s/user (TP=4, conc=128) up to $0.94/M at 140 tok/s/user (TP=8, conc=4).
Iso-Interactivity Performance per Dollar
Throughput per GPU and cost per million tokens at matched interactivity, interpolated along each SKU's Pareto frontier. Performance-per-dollar lift in the last column is the inverse of the $/M ratio — B200 NVFP4 perf/$ relative to H200. Cells outside a frontier's measured range render as unreachable.
| Interactivity (tok/s/user) | H200 FP8 MTP $/M | B200 FP8 MTP $/M | B200 NVFP4 MTP $/M | B200 NVFP4 perf/$ vs H200 |
|---|---|---|---|---|
| 25 | $0.46 | $0.34 | $0.14 | 3.24x |
| 30 | $0.50 | $0.37 | $0.15 | 3.32x |
| 40 | $0.58 | $0.43 | $0.17 | 3.44x |
| 50 | $0.69 | $0.51 | $0.19 | 3.54x |
| 60 | $0.80 | $0.60 | $0.22 | 3.60x |
| 70 | $0.93 | $0.72 | $0.26 | 3.63x |
| 80 | $1.06 | $0.87 | $0.29 | 3.65x |
| 84 | $1.12 | $0.94 | $0.31 | 3.64x |
| 100 | unreachable | $1.28 | $0.38 | ∞ |
| 120 | unreachable | unreachable | $0.51 | ∞ |
| 140 | unreachable | unreachable | $0.93 | ∞ |
B200 NVFP4's performance-per-dollar lift over H200 peaks at 3.65x at 80 tok/s/user and stays in the 3.24x–3.65x band across the entire H200 operating range — there is no interactivity at which H200 FP8 + MTP is even within 3x of B200 NVFP4 + MTP on this workload. The precision-only lift (B200 FP8 → B200 NVFP4) widens monotonically with interactivity, from 2.41x at 25 tok/s/user to 3.07x at 84 tok/s/user, because B200 FP8's perf/$ drops faster than B200 NVFP4 as batch shrinks. Above 84 tok/s/user the comparison stops being a comparison: H200 has no recipe that delivers another tok/s/user, while B200 NVFP4 extends another 60 tok/s/user of operating regime out to 140 tok/s/user on TP=8.
Live chart, pre-filtered to GLM-5 SGLang MTP on H200 + B200 for the 2026-05-25 run. Live cost view of the same comparison.
What's Next for Blackwell on GLM-5
Three gaps still narrow the headline number from here, all upstream-tracked:
- Disaggregated serving on NVL72. The numbers above are single-node aggregated. The tracking issue is actively closing FP8 B200 disaggregated 8K/1K and GB300 disaggregated MTP. Wide EP on NVL72 has already demonstrated a ~3x throughput-per-GPU advantage on Kimi K2.5 — the same lever should lift GLM-5's perf/$ further at the low-interactivity / high-throughput end where the FP4 frontier plateaus.
For chat-style GLM-5 serving in the 25–84 tok/s/user band on SGLang today, B200 NVFP4 + MTP delivers 3.2x–3.65x better performance per dollar than H200 FP8 + MTP across every measurable operating point.
Acknowledgments
This recipe loop moved fast because the SGLang NVIDIA collaboration closed every Functional and Baseline Perf row across no-MTP/MTP and Agg/Disagg on Blackwell in roughly a quarter — NVFP4 IMA fixes in FlashInfer, sparse MLA defaults on sm100/sm103, IndexCache, EAGLE-based MTP for GLM-5 — and the InferenceX recipe loop wired the H200 MTP sibling in one week after upstream stabilized. Thanks to the SGLang maintainers, the FlashInfer team, the NVIDIA SGLang collaboration thread, and everyone landing PRs on the tracking issue. Speed of the upstream-to-benchmark loop is the moat.
All articles and posts are © SemiAnalysis. All rights reserved. The AGPL-3.0 license covering the application source code does not apply to article content.