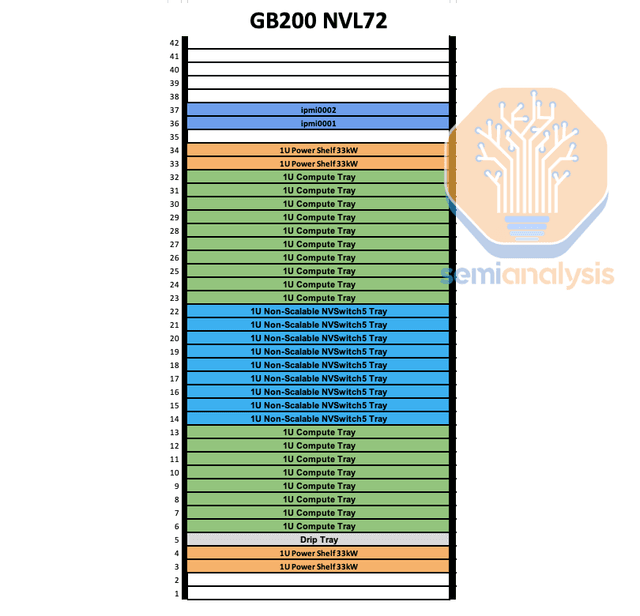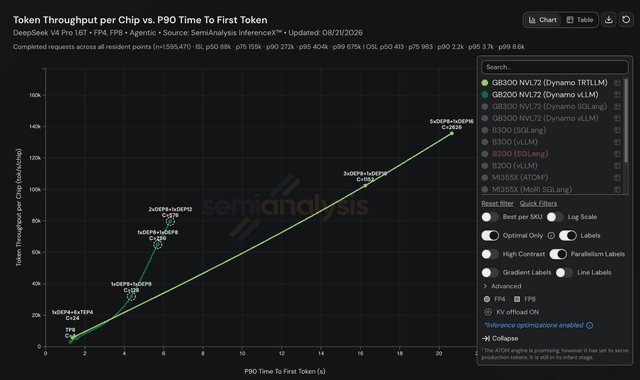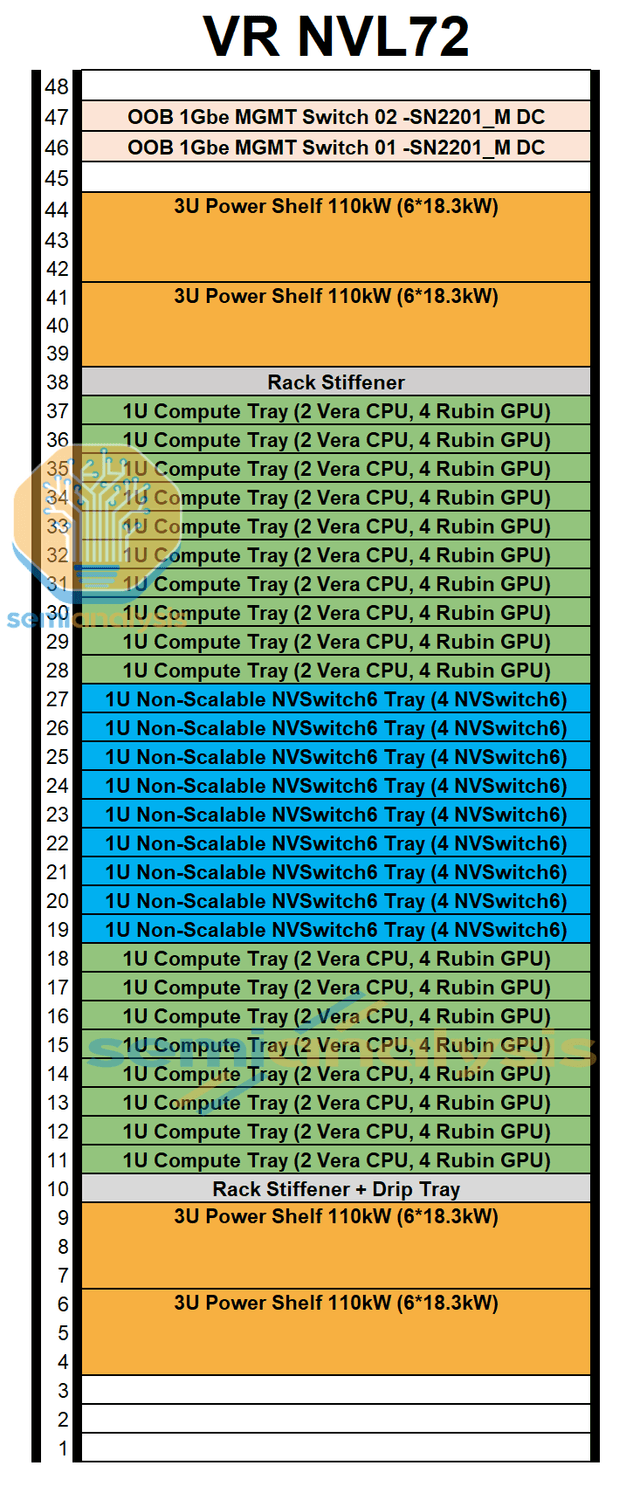
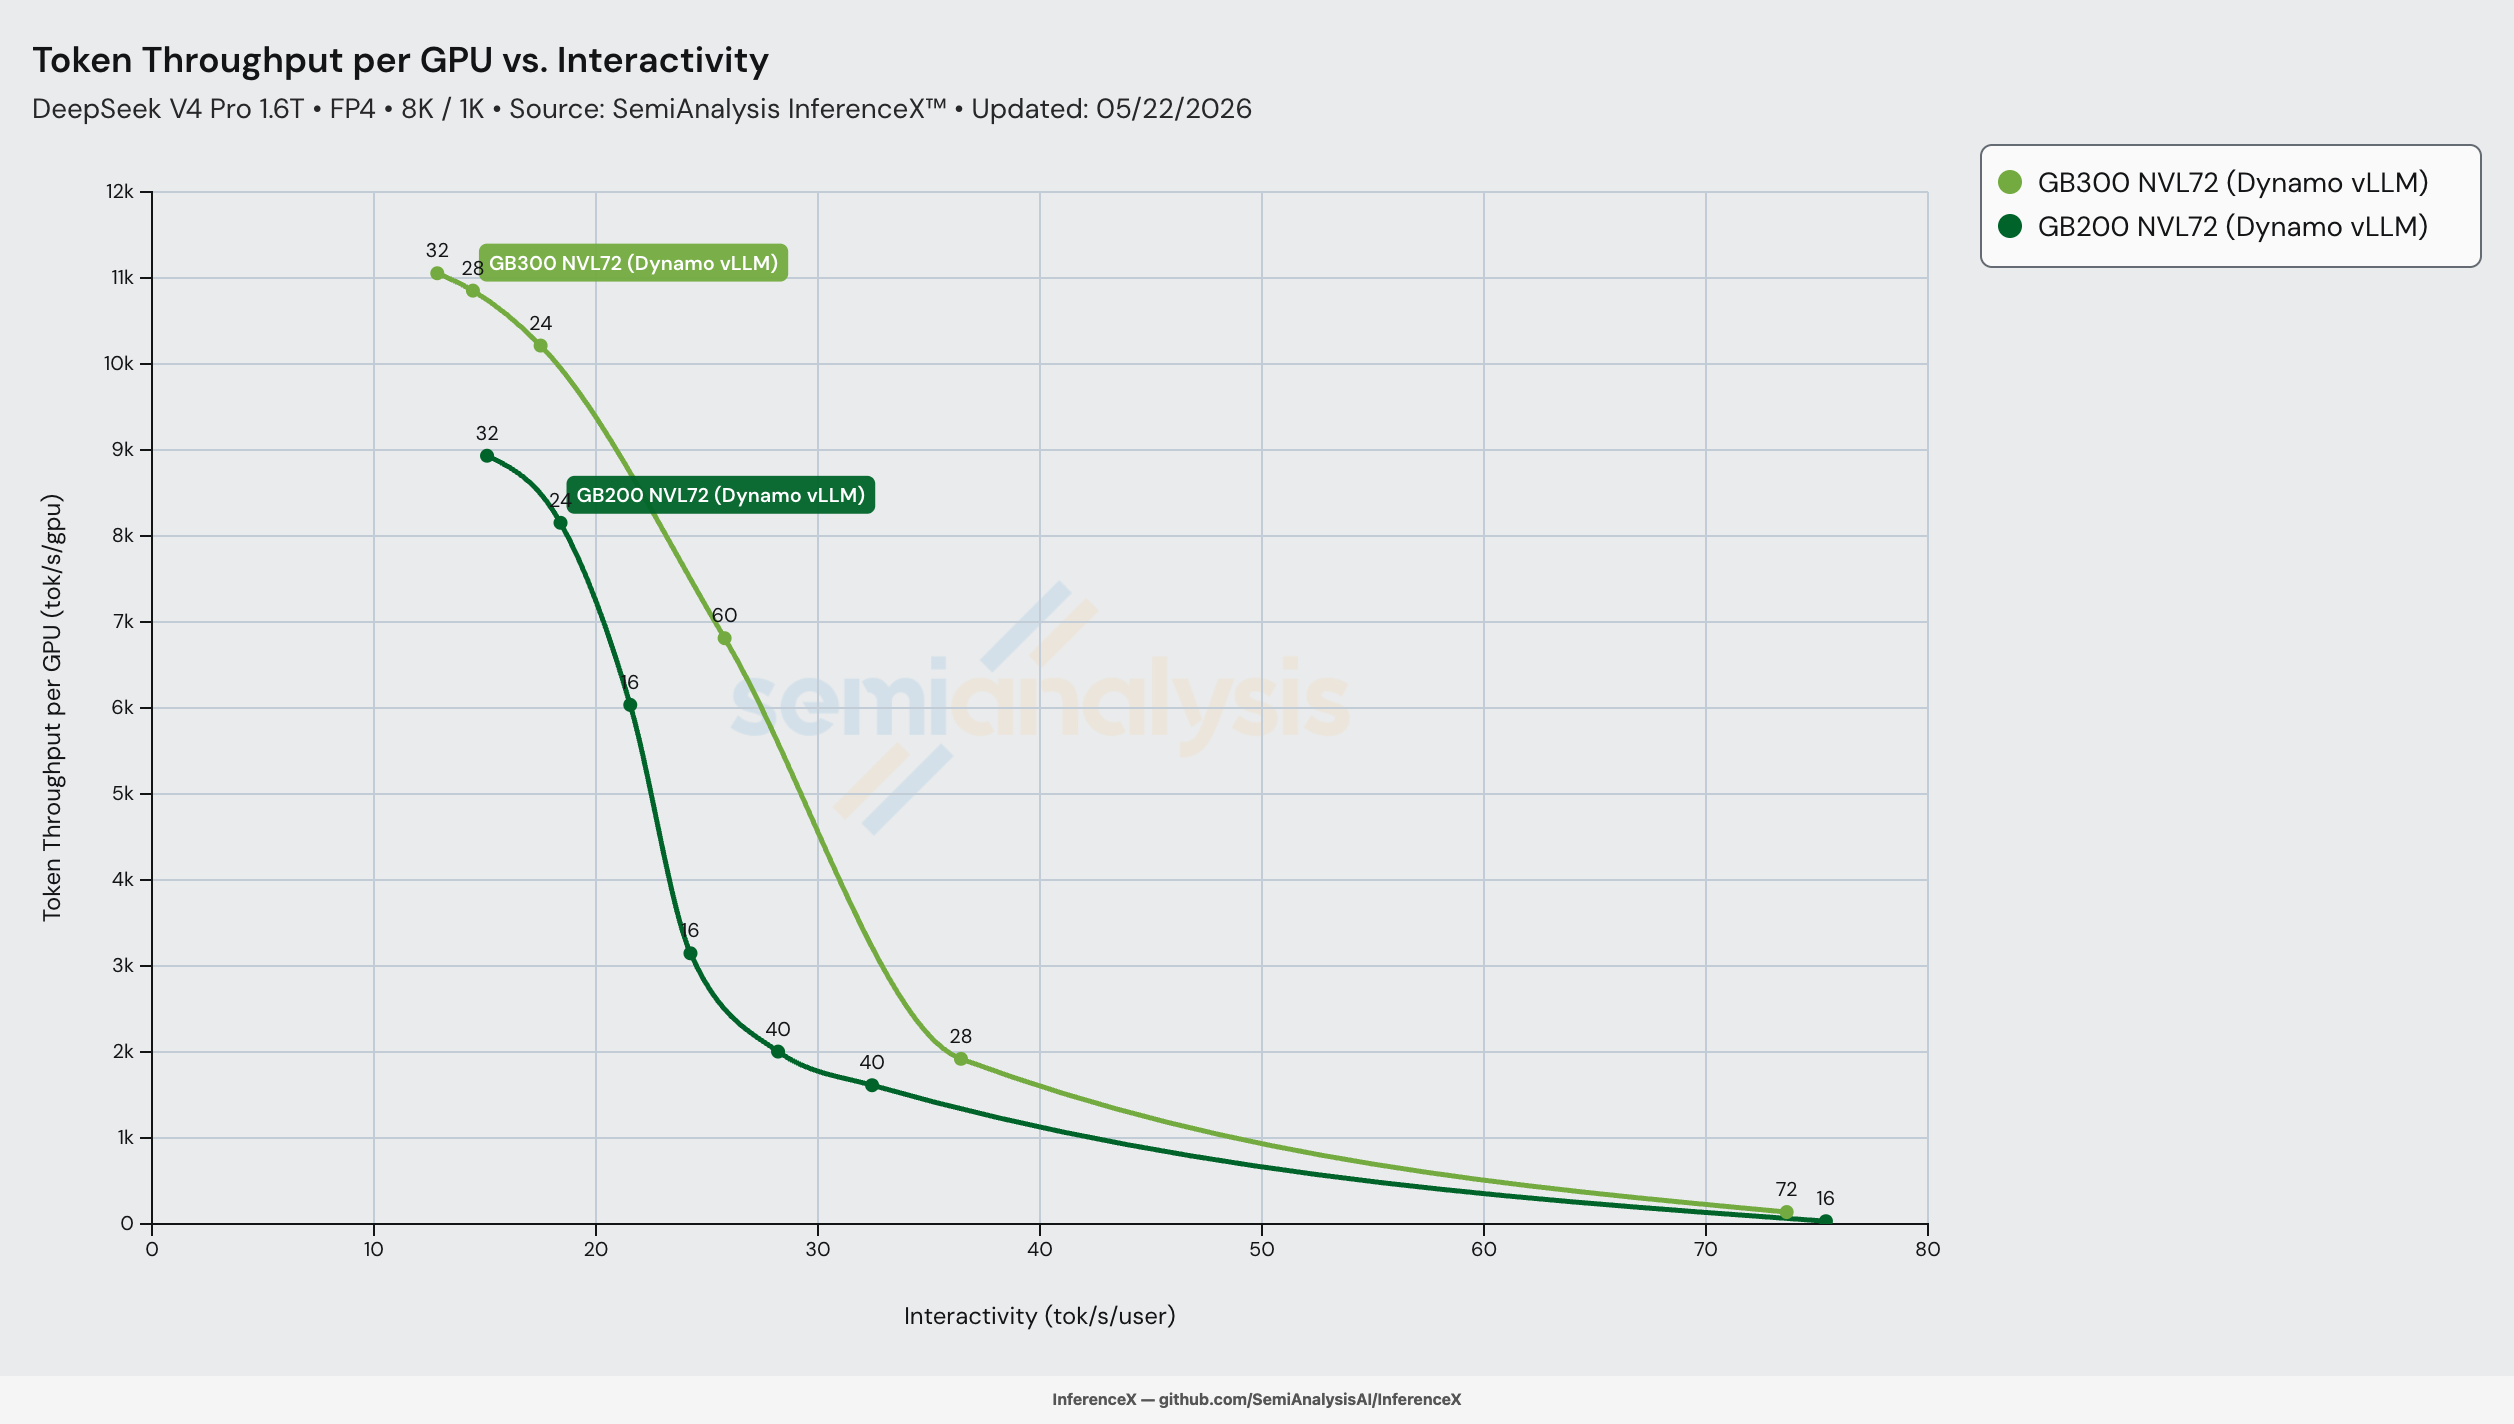
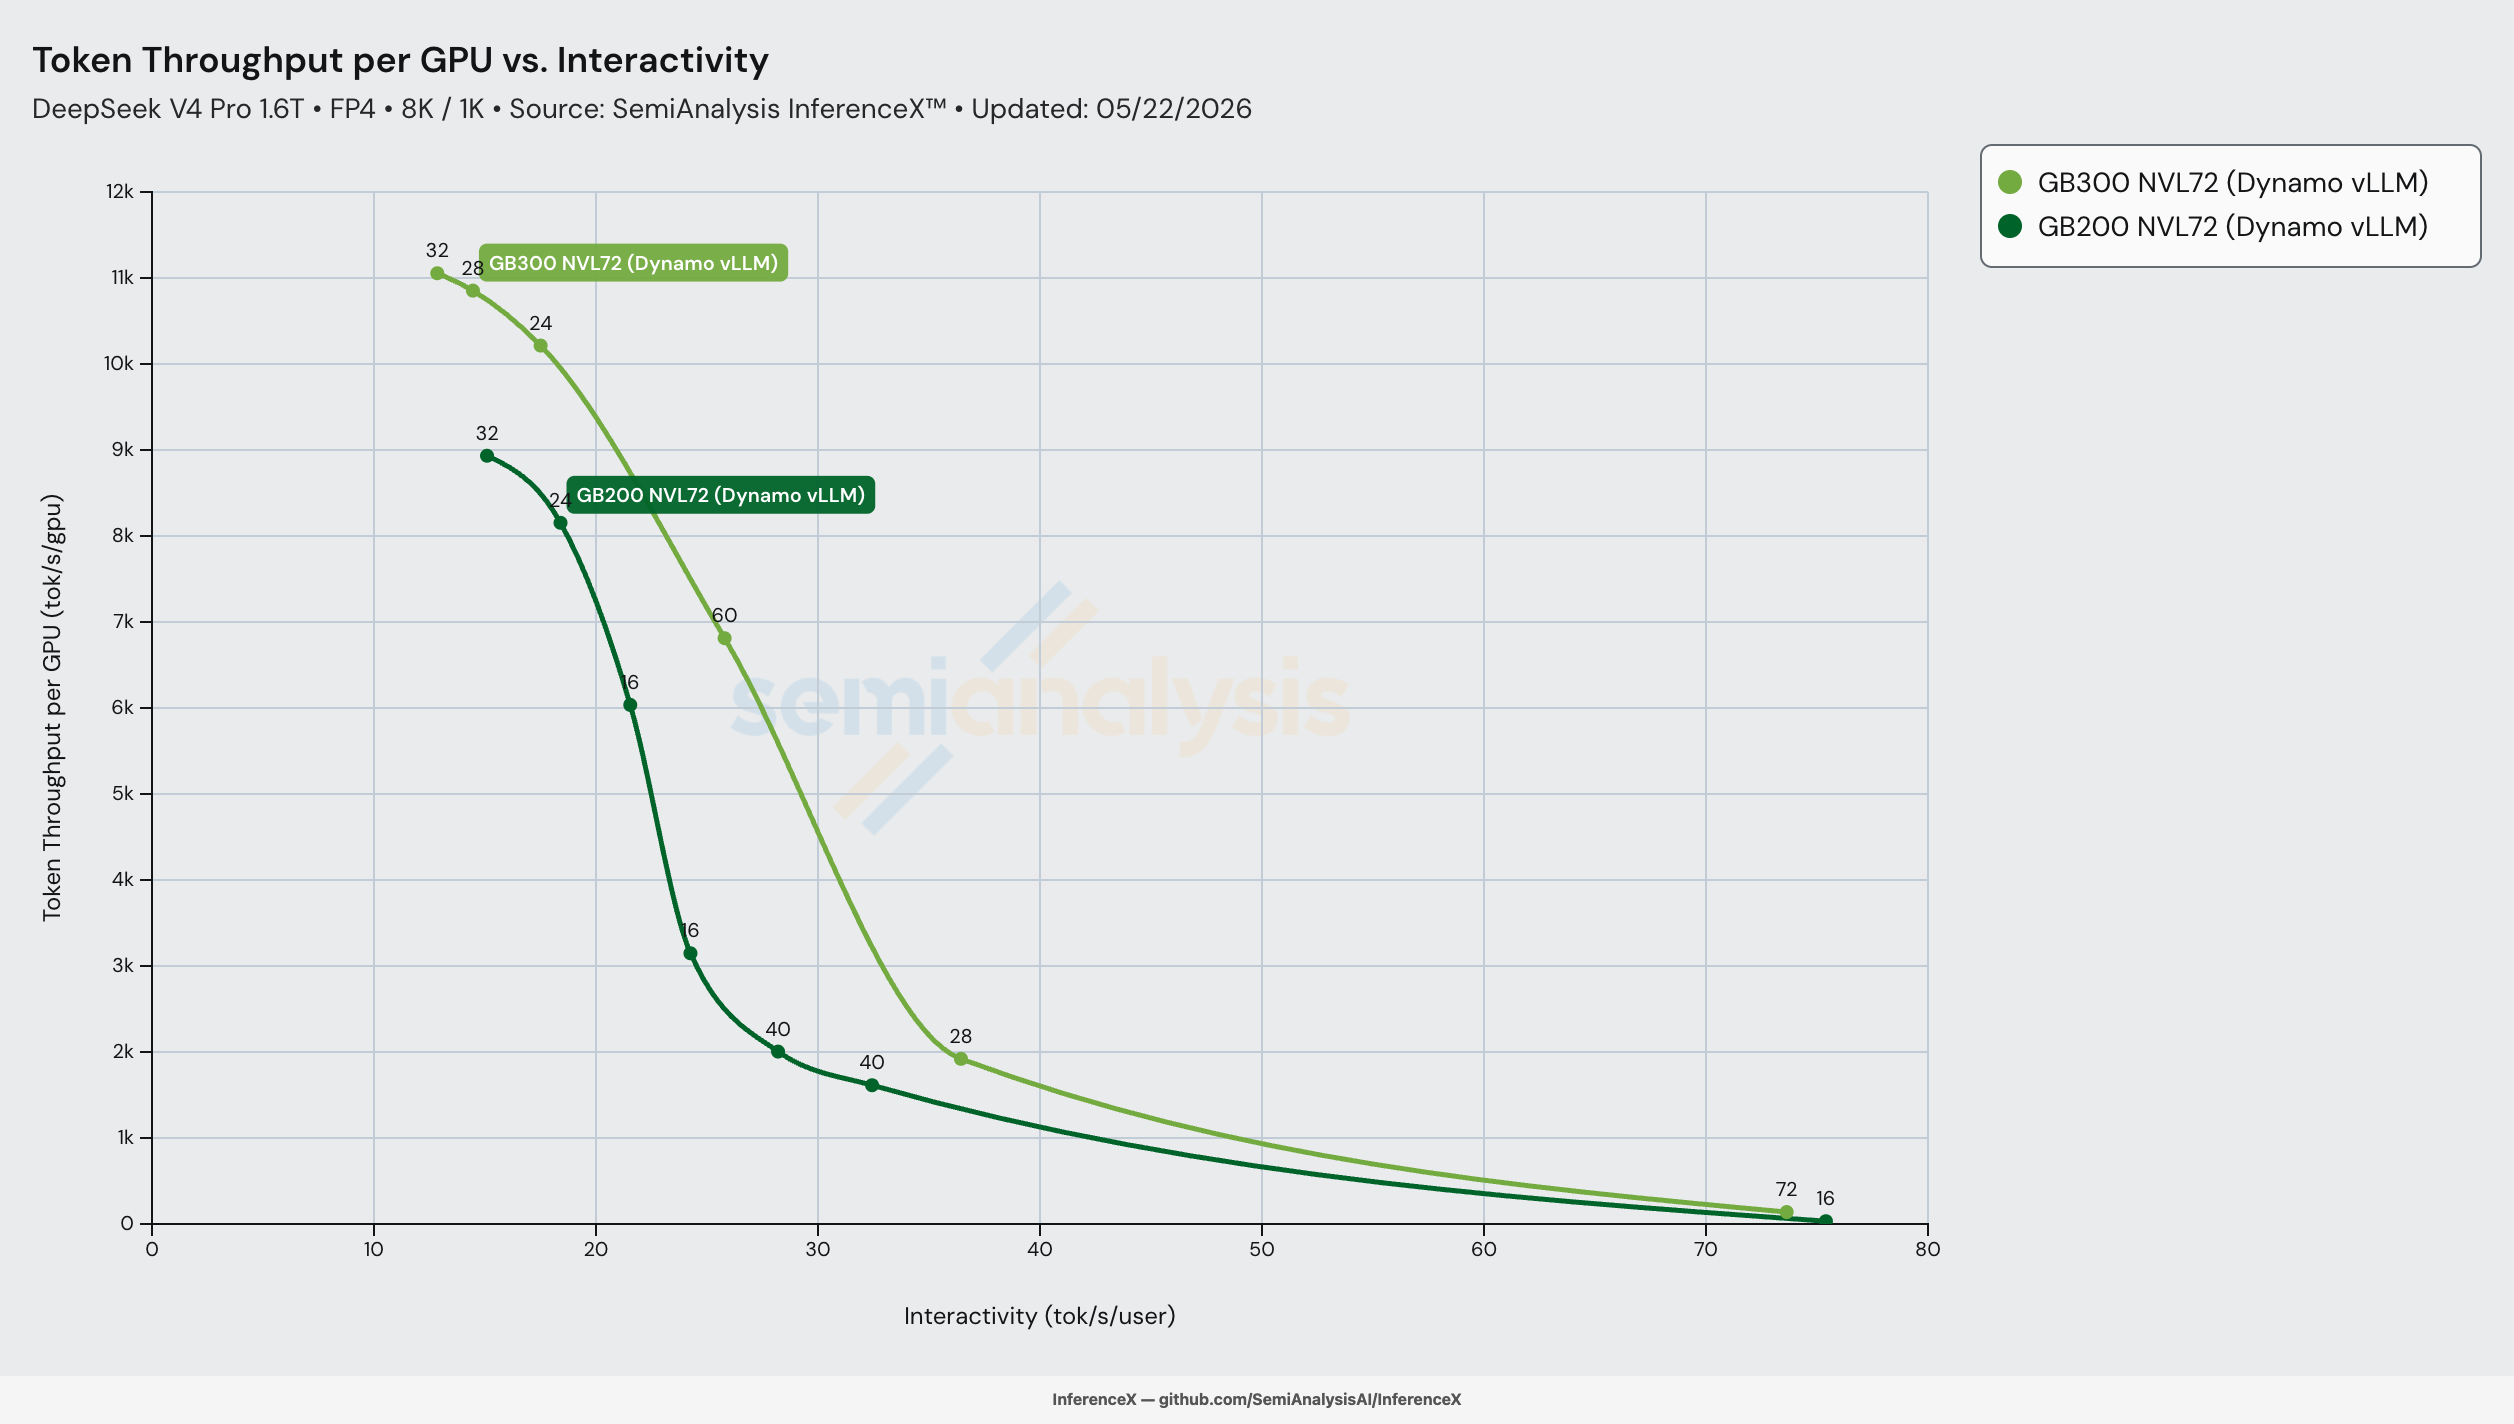
On DeepSeek-V4-Pro FP4 at 8K/1K with Dynamo vLLM and disaggregated prefill/decode on both racks, GB300 NVL72 delivers up to 2.83x throughput per GPU vs GB200 NVL72 at iso-interactivity, peaking at 27 tok/s/user (6,182 tok/s/GPU on GB300 vs 2,189 tok/s/GPU on GB200). On paper the silicon delta looks modest — same memory bandwidth, same NVLink fabric, same scale-up world size, only 1.5x more HBM capacity and 1.5x more FP4 — but the middle-of-curve gap blows past every static ratio because GB300's extra HBM removes a software constraint GB200 has to pay for.
The mechanism is HBM headroom. At 1.6T params, DSv4-Pro's FP4 weights alone are about 800 GB, and on GB200 the available HBM at narrow prefill shapes is tight enough that the recipe has to compromise on batch size to fit. GB300's 1.5x HBM capacity (288 vs 192 GB/GPU) holds the same model on the same shape with hundreds of GB of headroom to spare, so prefill can run a wider batch that keeps the wider decode pool saturated. After a 20% per-GPU TCO premium ($2.65 vs $2.21/GPU/hr per the SemiAnalysis AI Cloud TCO Model), GB300 still lands 2.31x cheaper per million tokens at 27 tok/s/user. More HBM, more save.
DeepSeek-V4-Pro Model Architecture
DeepSeek-V4-Pro is DeepSeek's flagship MoE: 1.6T total parameters with 49B activated per token (per the DeepSeek V4 preview announcement). The architecture pairs token-wise compression with DSA (DeepSeek Sparse Attention) — the sparse-attention pattern DeepSeek introduced in V3.2, extended to longer context (the official services run DSv4 at 1M default). The open-weights checkpoint is deepseek-ai/DeepSeek-V4-Pro.
On-Paper Specs
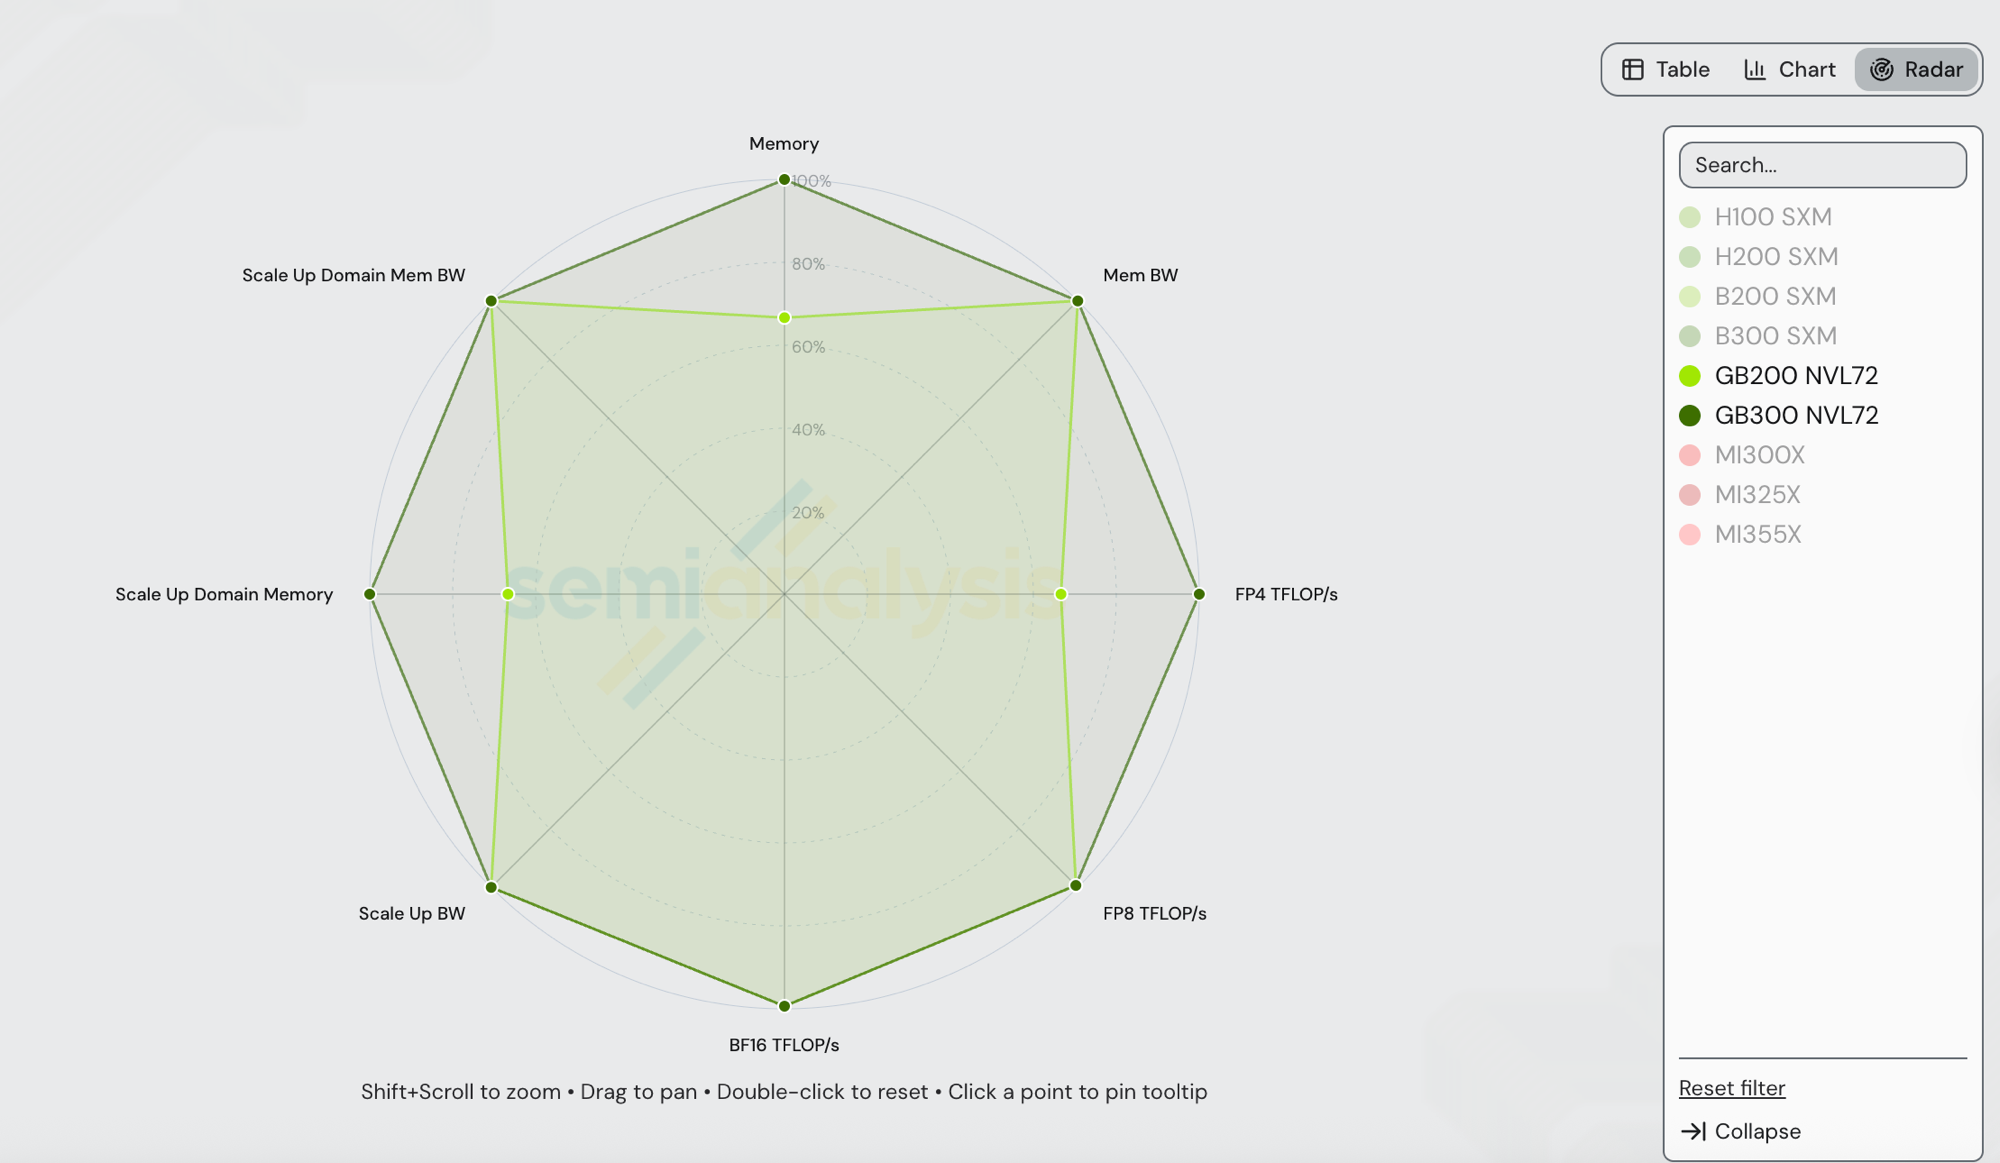
GB300 NVL72 (Blackwell Ultra) and GB200 NVL72 (Blackwell) share the same NVLink 5 scale-up fabric, the same 72-GPU world size, the same NVSwitch generation, and the same 8 TB/s HBM bandwidth per GPU. The deltas are HBM capacity and dense FP4. Values pulled directly from /gpu-specs:
| Spec | GB200 NVL72 | GB300 NVL72 | GB300 / GB200 |
|---|---|---|---|
| HBM capacity | 192 GB | 288 GB | 1.50x |
| HBM bandwidth | 8 TB/s | 8 TB/s | 1.00x |
| Dense FP4 (TFLOP/s) | 10,000 | 15,000 | 1.50x |
| Dense FP8 (TFLOP/s) | 5,000 | 5,000 | 1.00x |
| Dense BF16 (TFLOP/s) | 2,500 | 2,500 | 1.00x |
| Scale-up BW per GPU (uni-di) | 900 GB/s (NVLink 5) | 900 GB/s (NVLink 5) | 1.00x |
| Scale-up world size | 72 | 72 | 1.00x |
| Scale-up domain HBM capacity | 13.5 TB | 20.25 TB | 1.50x |
| Scale-up domain HBM BW (aggregate) | 576 TB/s | 576 TB/s | 1.00x |
| TCO (SemiAnalysis AI Cloud Model) | $2.21/GPU/hr | $2.65/GPU/hr | 1.20x |
If decode were purely HBM-bandwidth-bound and prefill were purely FP4-compute-bound, the on-paper perf/$ ceiling would be 1.50 / 1.20 = 1.25x on either bottleneck. The measured 2.31x perf/$ peak is 1.85x higher than that ceiling — which is the entire point of the post. The lift comes from a regime where the silicon ratio understates the system gain: HBM capacity is a discrete unlock for what recipe even fits, not a continuous knob, and a wider prefill+decode shape that one rack can run and the other can't is worth a factor that doesn't appear on any spec sheet.
What Disagg + Wide EP Actually Buy You
Inference on a sparse MoE has two phases with opposite resource profiles. Prefill is compute-bound: every token in a request is processed in parallel through the entire model, so DSv4-Pro's 384-routed-expert MoE lights up every expert at every layer for every prompt. Decode is memory-bandwidth-bound: each generated token only activates 6 of 384 routed experts (plus 1 shared expert) per layer, and the per-step cost is dominated by streaming whichever experts got routed through HBM. Running both on the same GPUs means prefill bursts constantly disrupt steady-state decode, and you end up underutilizing both.
Disaggregation splits them onto separate GPU pools that get tuned independently. Prefill instances run wide enough to amortize the all-experts-active compute step; decode instances run with whatever (TP, EP, DP) shape gives the best tokens-per-step under steady-state load. The two pools talk over the NVLink fabric (KV transfer from prefill → decode), and you can scale each independently.
Wide expert parallelism (EP) then takes the decode side and shards the routed experts across many ranks. At EP=4 each GPU holds 96 of DSv4-Pro's 384 routed experts, all of which must be resident in HBM and ready to stream for any token that routes to them. At EP=8 each GPU holds 48. At EP=16 each GPU holds 24 — the per-rank routed-expert weight footprint shrinks roughly linearly, and the rest of HBM goes to KV cache and activations. The wider you shard, the more thinly each GPU's HBM bandwidth has to spread when servicing requests routed to its experts, and the more efficient per-GPU decode becomes. Every additional rank in the EP group is doing useful work for every other rank — that's the "more you buy, the more you save" lever, applied not to bulk-rate hardware discounts but to actual silicon utilization.
The catch is that wide EP fires a routed all-to-all dispatch before each MoE layer's expert GEMMs and an all-to-all combine after. Across DSv4-Pro's MoE layers that is hundreds of collectives per token. They have to overlap behind the GEMM compute or they expose themselves as raw latency. On NVLink 5 (900 GB/s per GPU uni-di, 1.8 TB/s bi-di), the dispatch fits inside the GEMM time budget for EP=8 through EP=16 medium-batch decode, and the runtime hides it. On the scale-out side (ConnectX-7 RoCEv2 Ethernet or InfiniBand at 50 GB/s per GPU uni-di, 18x slower), the same collective takes 18x longer and exposes itself — which is why wide EP requires the rack-scale NVLink island, and why both GB200 NVL72 and GB300 NVL72 win against any 8-GPU HGX node on this workload regardless of who shipped first.
The Numbers
All rows are DeepSeek-V4-Pro FP4 at ISL 8192 / OSL 1024 on NVL72, Dynamo vLLM, disaggregated prefill/decode, no speculative decoding, measured on InferenceX on 2026-05-22 (GHA run 26306422380). Cost per million total tokens is TCO_$/GPU/hr × 1e6 / (3600 × tput_per_gpu), with GB200 NVL72 at $2.21/GPU/hr and GB300 NVL72 at $2.65/GPU/hr per the SemiAnalysis AI Cloud TCO Model.
GB200 NVL72 (Dynamo vLLM), DSv4-Pro FP4 8K/1K disagg:
| Conc | Prefill | Decode | tok/s/GPU | tok/s/user | TPOT (ms) | $/M tok |
|---|---|---|---|---|---|---|
| 1 | 8 GPU, TP=8 | 8 GPU, EP=1 | 32.8 | 74.13 | 13.26 | $18.72 |
| 256 | 8 GPU, TP=8 | 32 GPU, EP=1 | 1,613.8 | 32.69 | 30.83 | $0.38 |
| 512 | 8 GPU, TP=8 | 32 GPU, EP=1 | 2,004.5 | 28.31 | 35.46 | $0.31 |
| 256 | 8 GPU, TP=8 | 8 GPU, EP=8 | 3,148.0 | 24.42 | 41.23 | $0.20 |
| 512 | 8 GPU, TP=8 | 8 GPU, EP=8 | 5,336.2 | 21.26 | 47.43 | $0.10 |
| 1024 | 8 GPU, TP=8 | 8 GPU, EP=8 | 6,036.2 | 21.60 | 46.42 | $0.10 |
| 4096 | 16 GPU, TP=8 | 8 GPU, EP=8 | 8,153.1 | 18.51 | 54.34 | $0.08 |
| 4096 | 24 GPU, TP=8 | 8 GPU, EP=8 | 8,933.0 | 15.26 | 66.26 | $0.07 |
GB300 NVL72 (Dynamo vLLM), DSv4-Pro FP4 8K/1K disagg:
| Conc | Prefill | Decode | tok/s/GPU | tok/s/user | TPOT (ms) | $/M tok |
|---|---|---|---|---|---|---|
| 18 | 4 GPU, TP=4 | 68 GPU, EP=1 | 138.8 | 73.43 | 13.58 | $5.31 |
| 192 | 4 GPU, TP=4 | 24 GPU, EP=1 | 1,920.0 | 36.78 | 27.44 | $0.38 |
| 3072 | 28 GPU, TP=8 | 32 GPU, EP=16 | 6,812.0 | 25.91 | 38.77 | $0.11 |
| 4096 | 16 GPU, TP=8 | 8 GPU, EP=8 | 10,214.0 | 17.58 | 57.12 | $0.07 |
| 4096 | 20 GPU, TP=8 | 8 GPU, EP=8 | 10,853.1 | 14.74 | 69.17 | $0.07 |
| 4096 | 24 GPU, TP=8 | 8 GPU, EP=8 | 11,055.6 | 13.12 | 77.83 | $0.07 |
GB200's peak throughput per GPU is 8,933 at 15.3 tok/s/user. GB300's peak is 11,056 at 13.1 tok/s/user — 1.24x more tok/s/GPU at a lower interactivity floor, close to the 1.5x silicon ratio after software overhead. The throughput-per-dollar at peak is essentially tied ($0.069 vs $0.067) because GB300's 20% TCO premium eats most of the 1.24x throughput lift. The headline ratio shows up not at peak but in the middle of the curve, where GB300's HBM headroom buys a recipe GB200 doesn't have.
Iso-Interactivity Comparison
Throughput per GPU and cost per million tokens at matched interactivity, interpolated along each SKU's Pareto frontier. Cells outside a frontier's measured range render as _unreachable_.
| Interactivity (tok/s/user) | GB200 tok/s/GPU | GB300 tok/s/GPU | GB300 / GB200 | GB200 $/M tok | GB300 $/M tok | GB200 / GB300 |
|---|---|---|---|---|---|---|
| 16 | 8,835 | 10,608 | 1.20x | $0.07 | $0.07 | 1.00x |
| 18 | 8,366 | 10,094 | 1.21x | $0.07 | $0.07 | 1.01x |
| 20 | 7,283 | 9,401 | 1.29x | $0.08 | $0.08 | 1.07x |
| 22 | 5,650 | 8,562 | 1.52x | $0.11 | $0.08 | 1.31x |
| 25 | 2,846 | 7,208 | 2.53x | $0.21 | $0.10 | 2.11x |
| 27 | 2,189 | 6,182 | 2.83x | $0.28 | $0.12 | 2.31x |
| 28 | 2,058 | 5,789 | 2.81x | $0.30 | $0.13 | 2.30x |
| 32 | 1,661 | 3,570 | 2.15x | $0.36 | $0.21 | 1.76x |
| 36 | 1,376 | 2,036 | 1.48x | $0.65 | $0.35 | 1.88x |
| 50 | 649 | 941 | 1.45x | $4.78 | $1.58 | 3.03x |
The headline 2.83x throughput per GPU peak at 27 tok/s/user (2.31x perf/$) sits in the middle of the curve, not at peak throughput. Below 20 tok/s/user both racks run wide enough prefill batches that the HBM-headroom advantage rounds away; above 36 tok/s/user both run narrow batches where neither rack has a recipe that wide-EP can fully exploit. The 22–32 tok/s/user band is where GB300's 1.5x HBM capacity lets it sit on a higher Pareto knot (conc=3072, 28 GPU prefill, 32 GPU decode EP=16, 6,812 tok/s/GPU at 25.9 tok/s/user) that GB200 has no equivalent for — its closest recipes at the same interactivity are conc=256 / 512 on a 32-GPU decode pool that delivers only 1,614–2,005 tok/s/GPU.
The 50 tok/s/user row shows the cost ratio (3.03x) widening again as both curves enter their steep right-side decay. The interpretation here is more cautious — both racks have very thin Pareto coverage out there (one knot each at ~33 tok/s/user for GB200 / ~37 tok/s/user for GB300, then the long tail out to ~73 tok/s/user), so the interpolated values are reading a wide gap between two measured knots. The 22–32 tok/s/user band is the honest sweet spot for the GB300 advantage; treat the 50 tok/s/user row as directional.
Live chart, pre-filtered to GB200 NVL72 and GB300 NVL72 Dynamo vLLM on DSv4-Pro FP4 8K/1K for the 2026-05-22 run.
Acknowledgments
Thanks to NVIDIA's Dynamo and vLLM teams — including Jatin Gangani, Kedar Potdar, Sridhar Ramaswamy, Ishan Dhanani, and Sahithi Chigurupati — and the vLLM team for shipping the GB200 and GB300 DSv4-Pro recipes that made the rack-to-rack comparison possible. Companion piece: GB200 NVL72 vs B200 on DeepSeek R1 covers the scale-up fabric advantage one step down the SKU ladder.
All articles and posts are © SemiAnalysis. All rights reserved. The AGPL-3.0 license covering the application source code does not apply to article content.