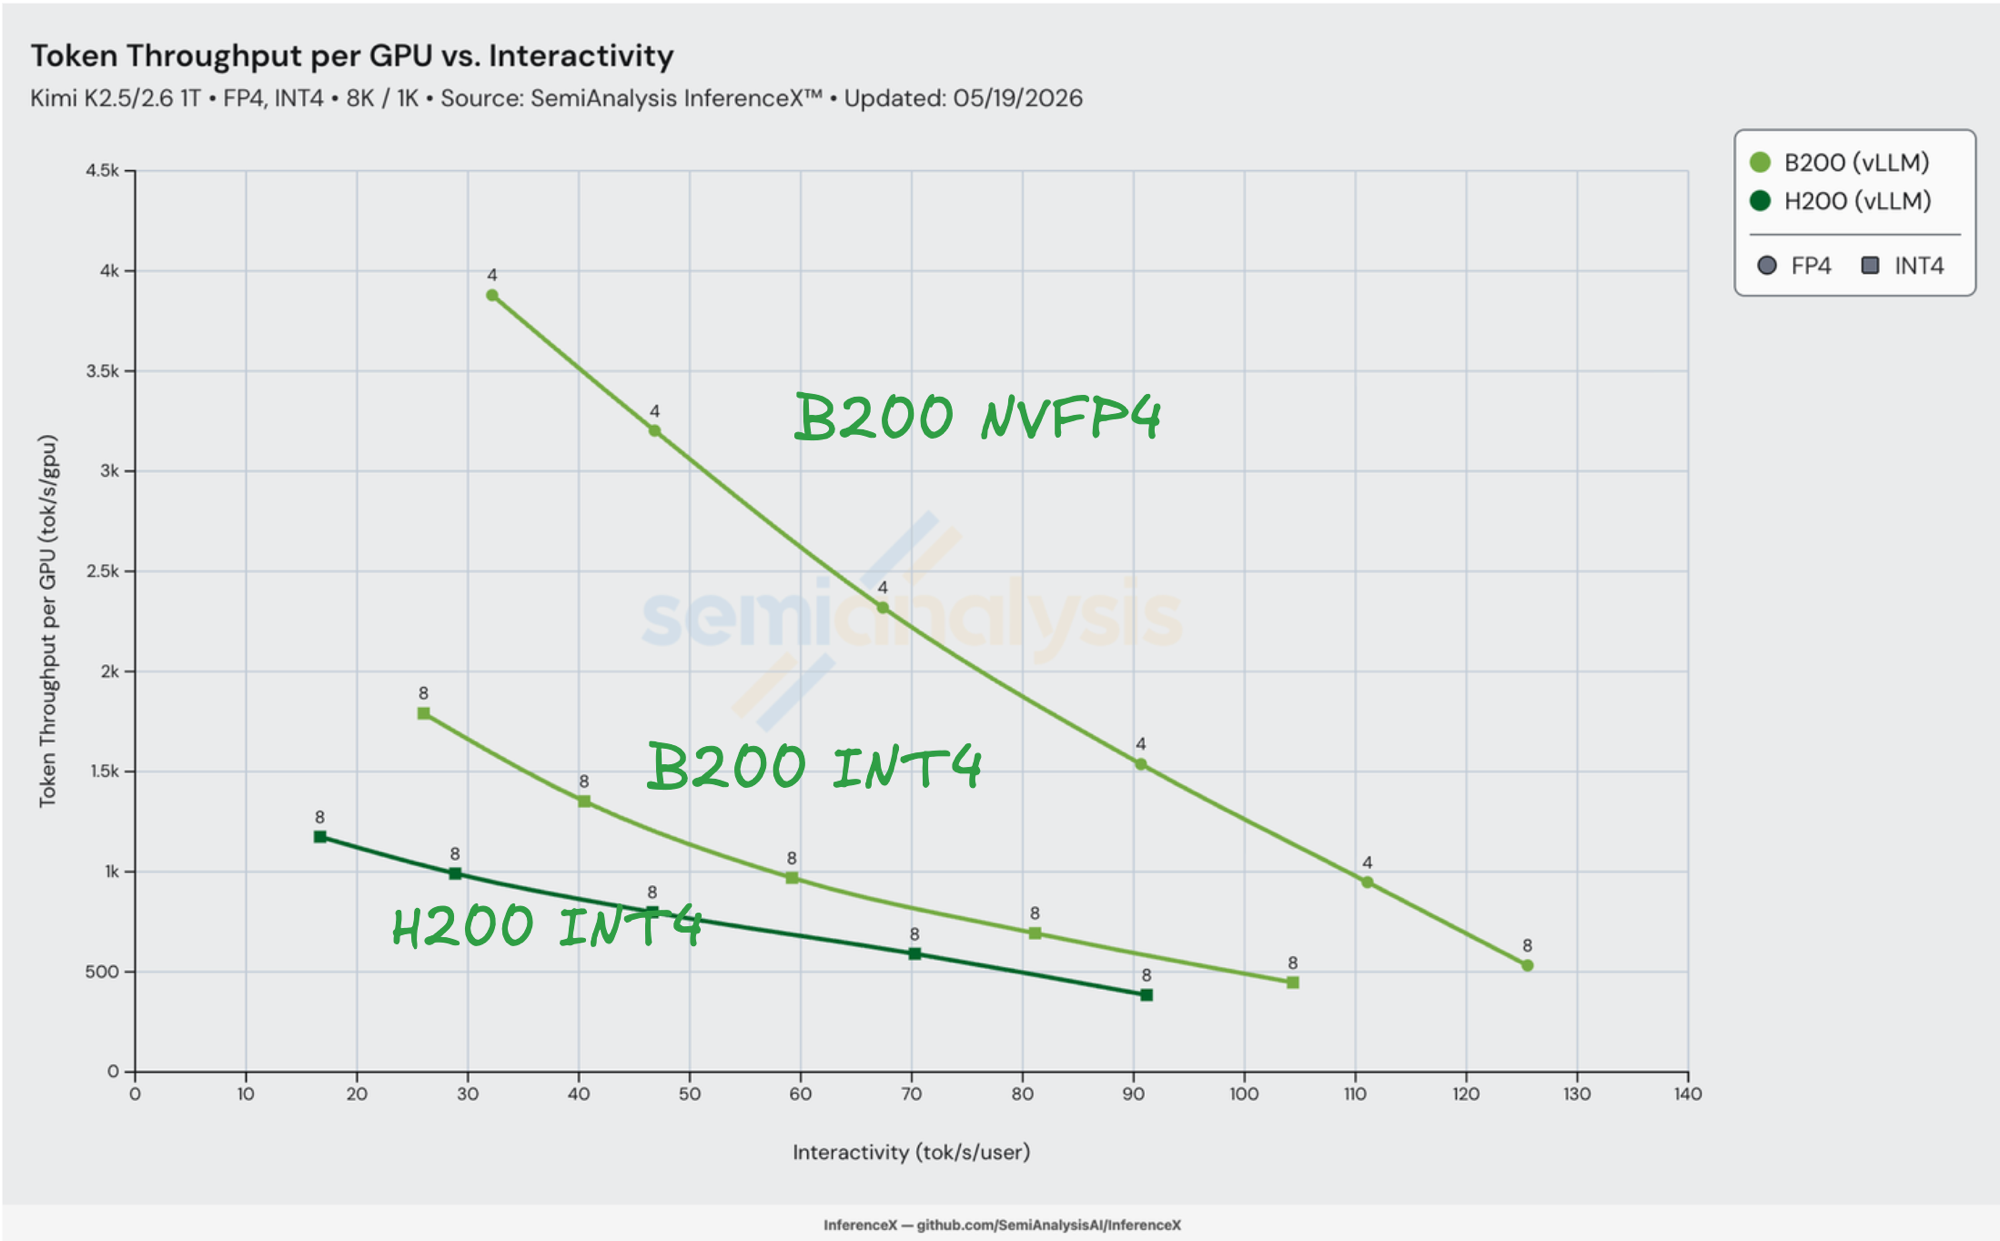
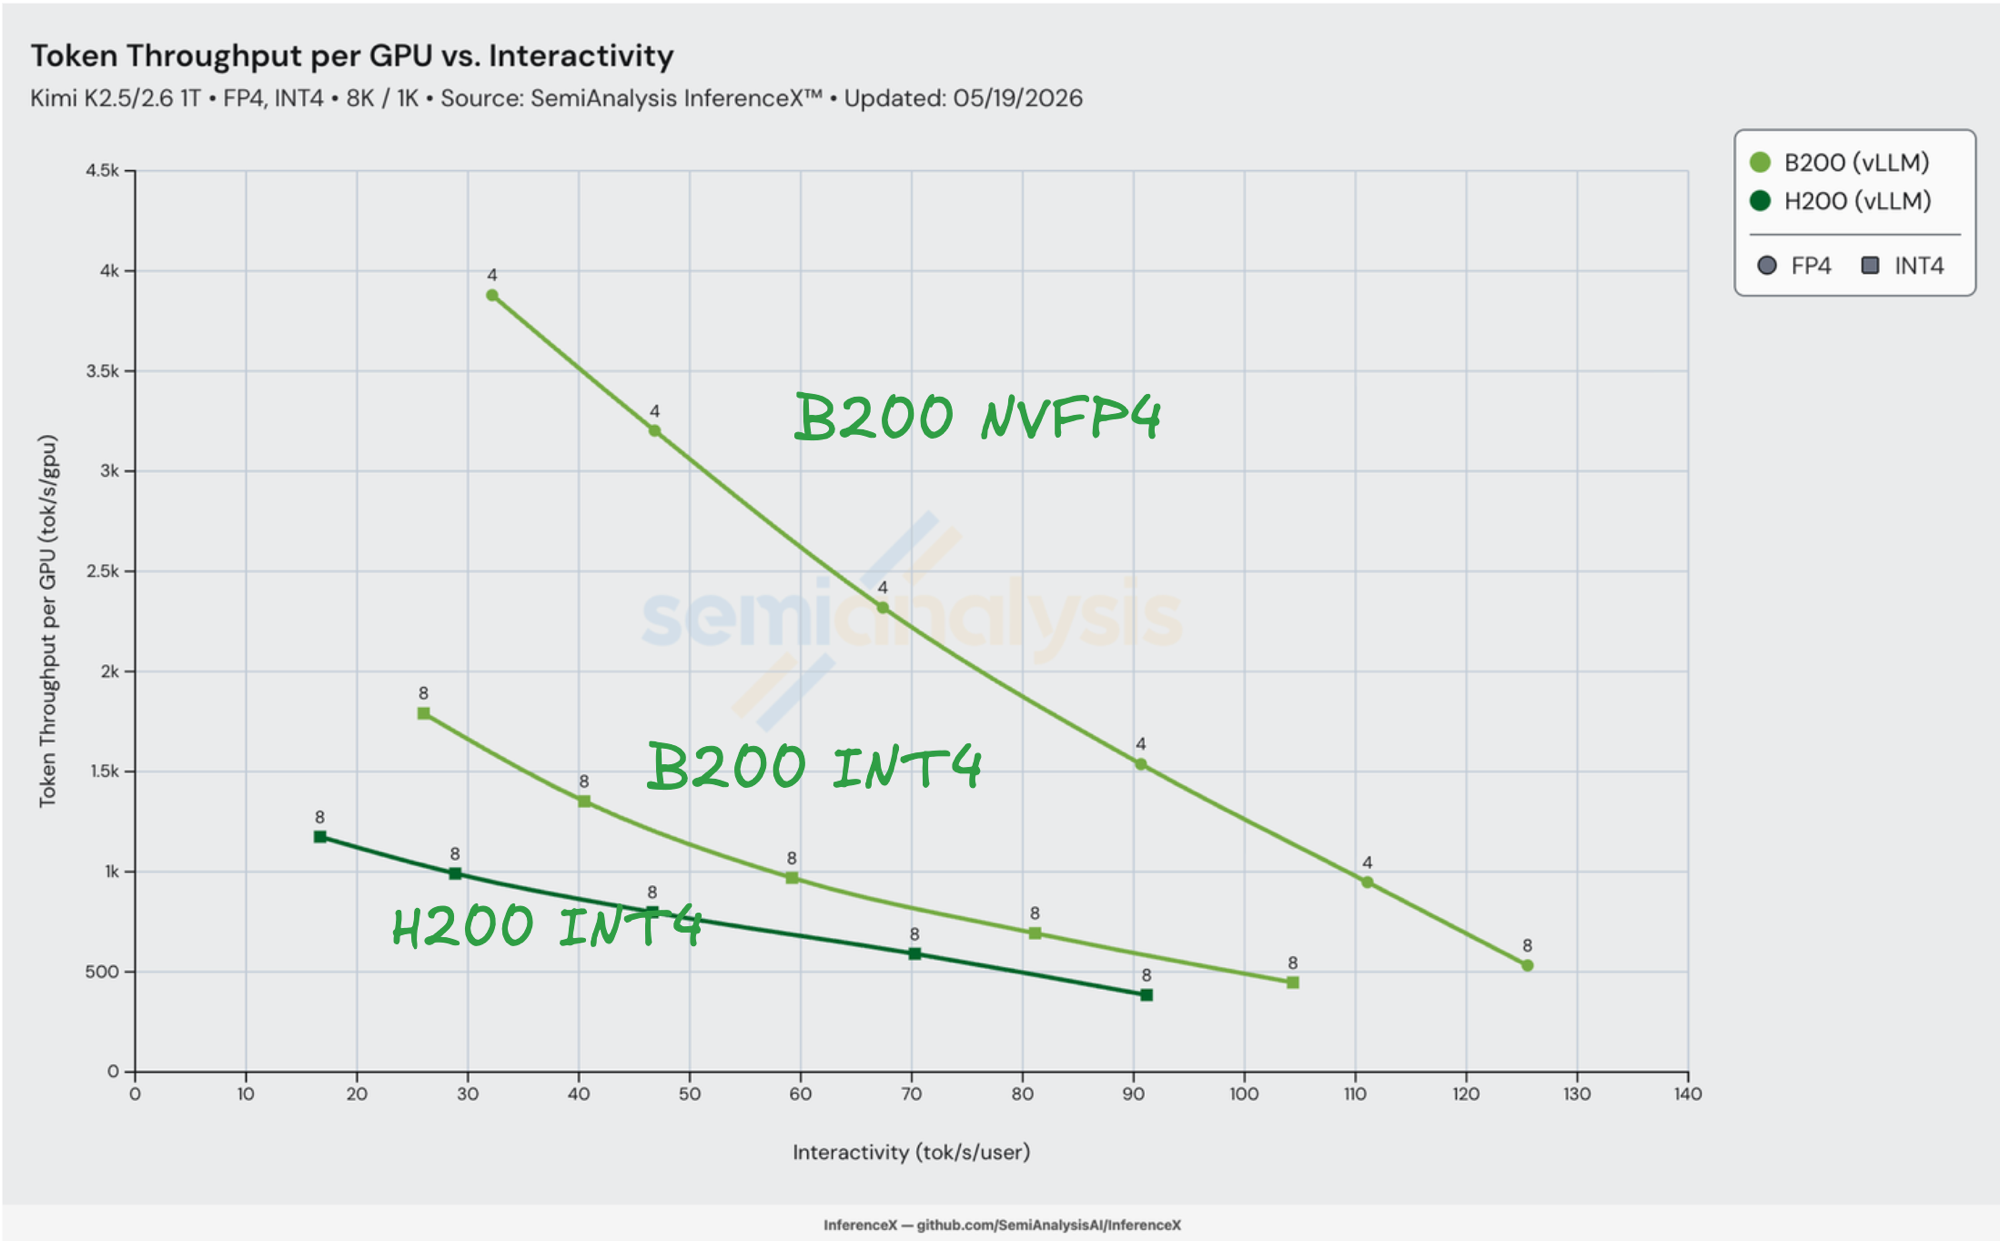
Kimi K2.5 and K2.6 are the open-weights models behind xAI's Cursor Composer 2 and Composer 2.5 — 1M+ daily active users from the Cursor IDE, and the current leader on SWE-Bench Pro at 58.6%. On the 8K/1K workload, vLLM on NVIDIA B200 in NVFP4 serves K2.5/K2.6 cheaper than H200 in INT4 across the entire single-node Pareto frontier. B200 NVFP4 is 2.71x–2.95x cheaper per million tokens than H200 INT4 in the 30–90 tok/s/user serving band, peaking at 2.95x at 32 tok/s/user ($0.140/M on B200 NVFP4 vs $0.413/M on H200 INT4 — a 66% reduction). On the same B200 silicon, swapping INT4 for NVFP4 is worth another 2.45x–2.74x at iso-interactivity ($0.397/M → $0.154/M at 40 tok/s/user). Measured on SemiAnalysis InferenceX, 2026-05-19, GHA run 26118912054.
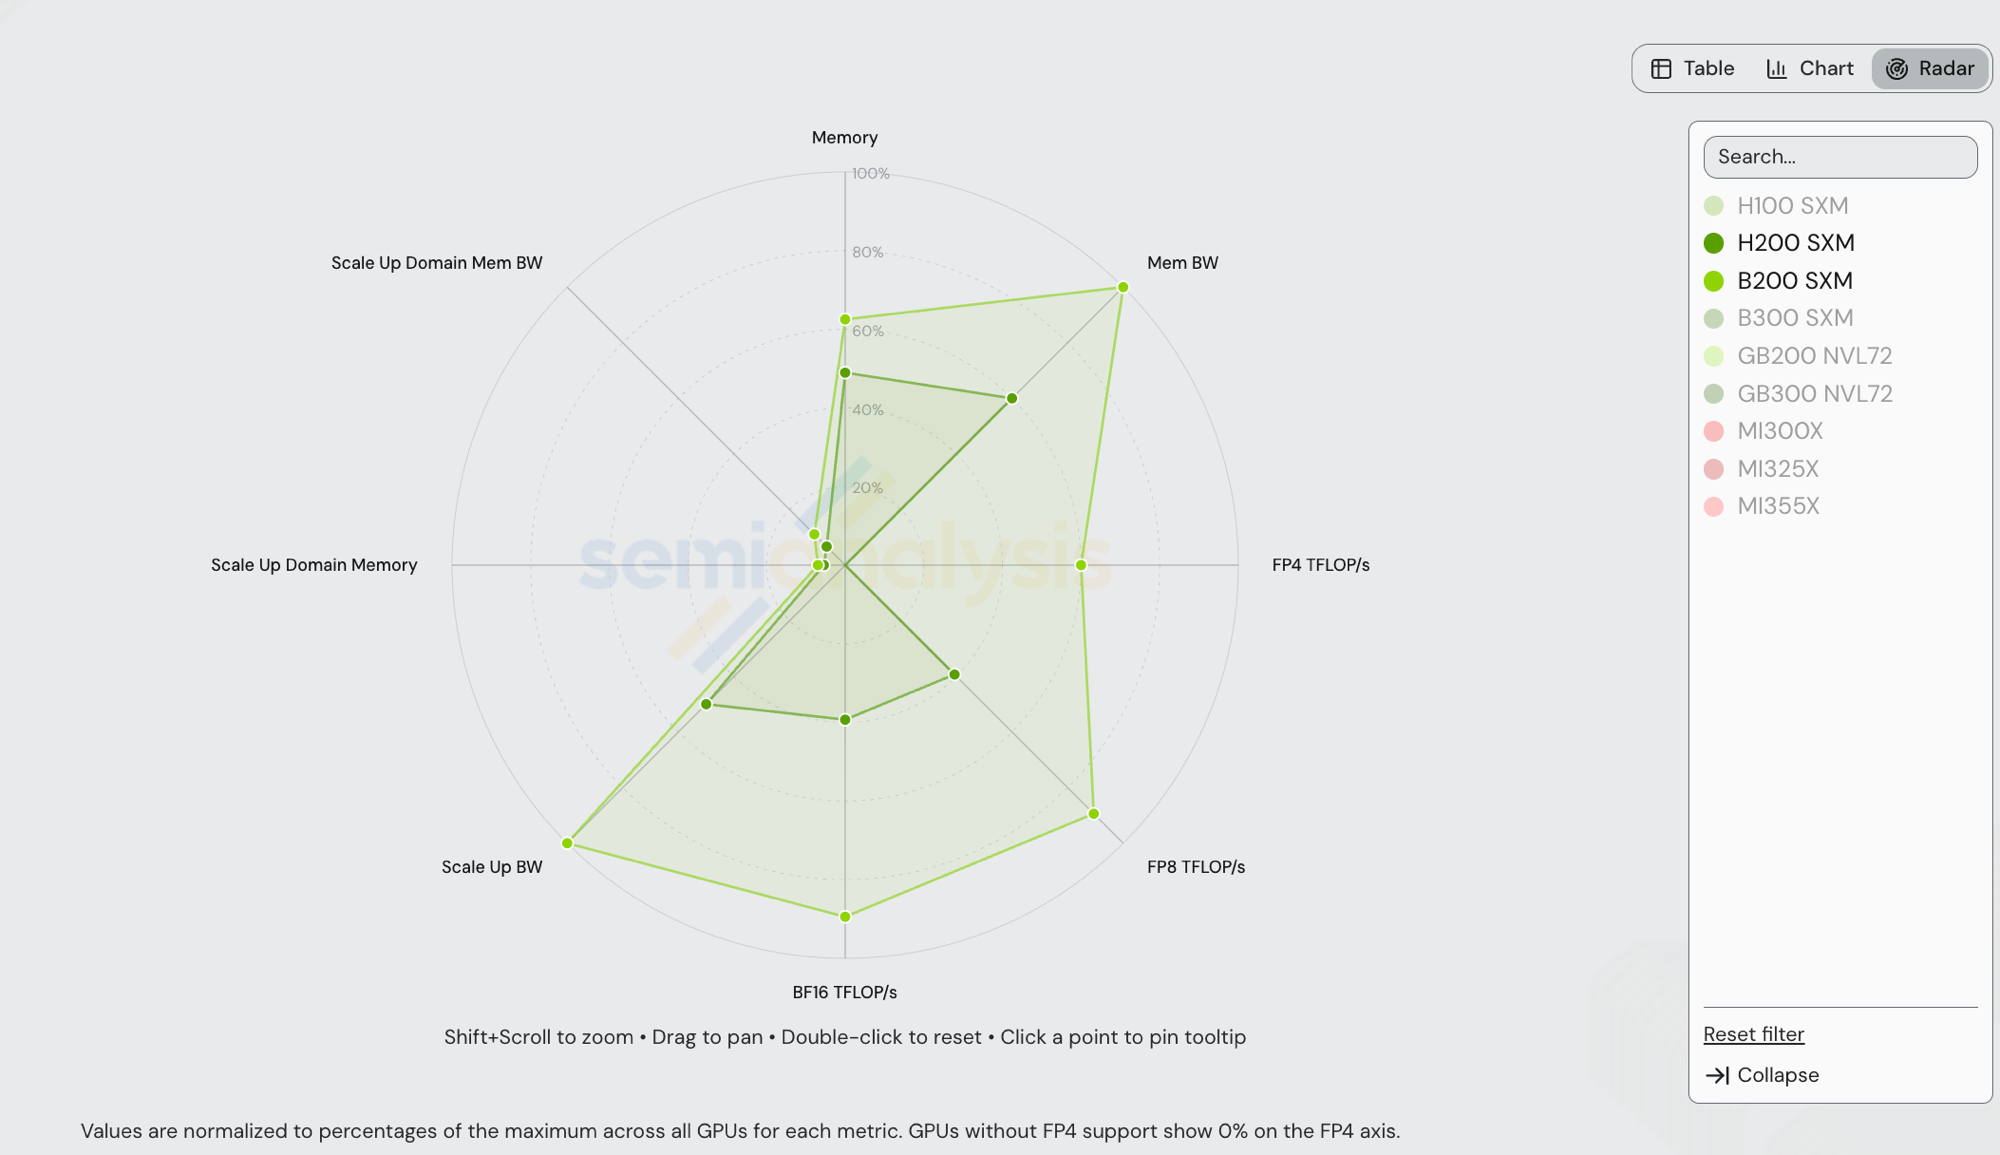
Both SKUs run the same vllm/vllm-openai:v0.21.0 container. The spread comes from the silicon and the precision. B200 has 2.27x H200's FP8 dense throughput (4,500 vs 1,979 TFLOP/s), 1.67x its HBM bandwidth (8 vs 4.8 TB/s), and 2.00x its NVLink scale-up bandwidth (900 vs 450 GB/s uni-di). On the FP4 axis H200 has nothing — Hopper SM90 has no FP4 tensor cores, and the official datasheet stops at FP8. B200's NVFP4 cores deliver 9,000 TFLOP/s. The measured 3x cost-per-token gap is what those silicon ratios look like once you fold in B200's 1.38x TCO penalty ($1.95 vs $1.41 per GPU/hr per the SemiAnalysis AI Cloud TCO Model).
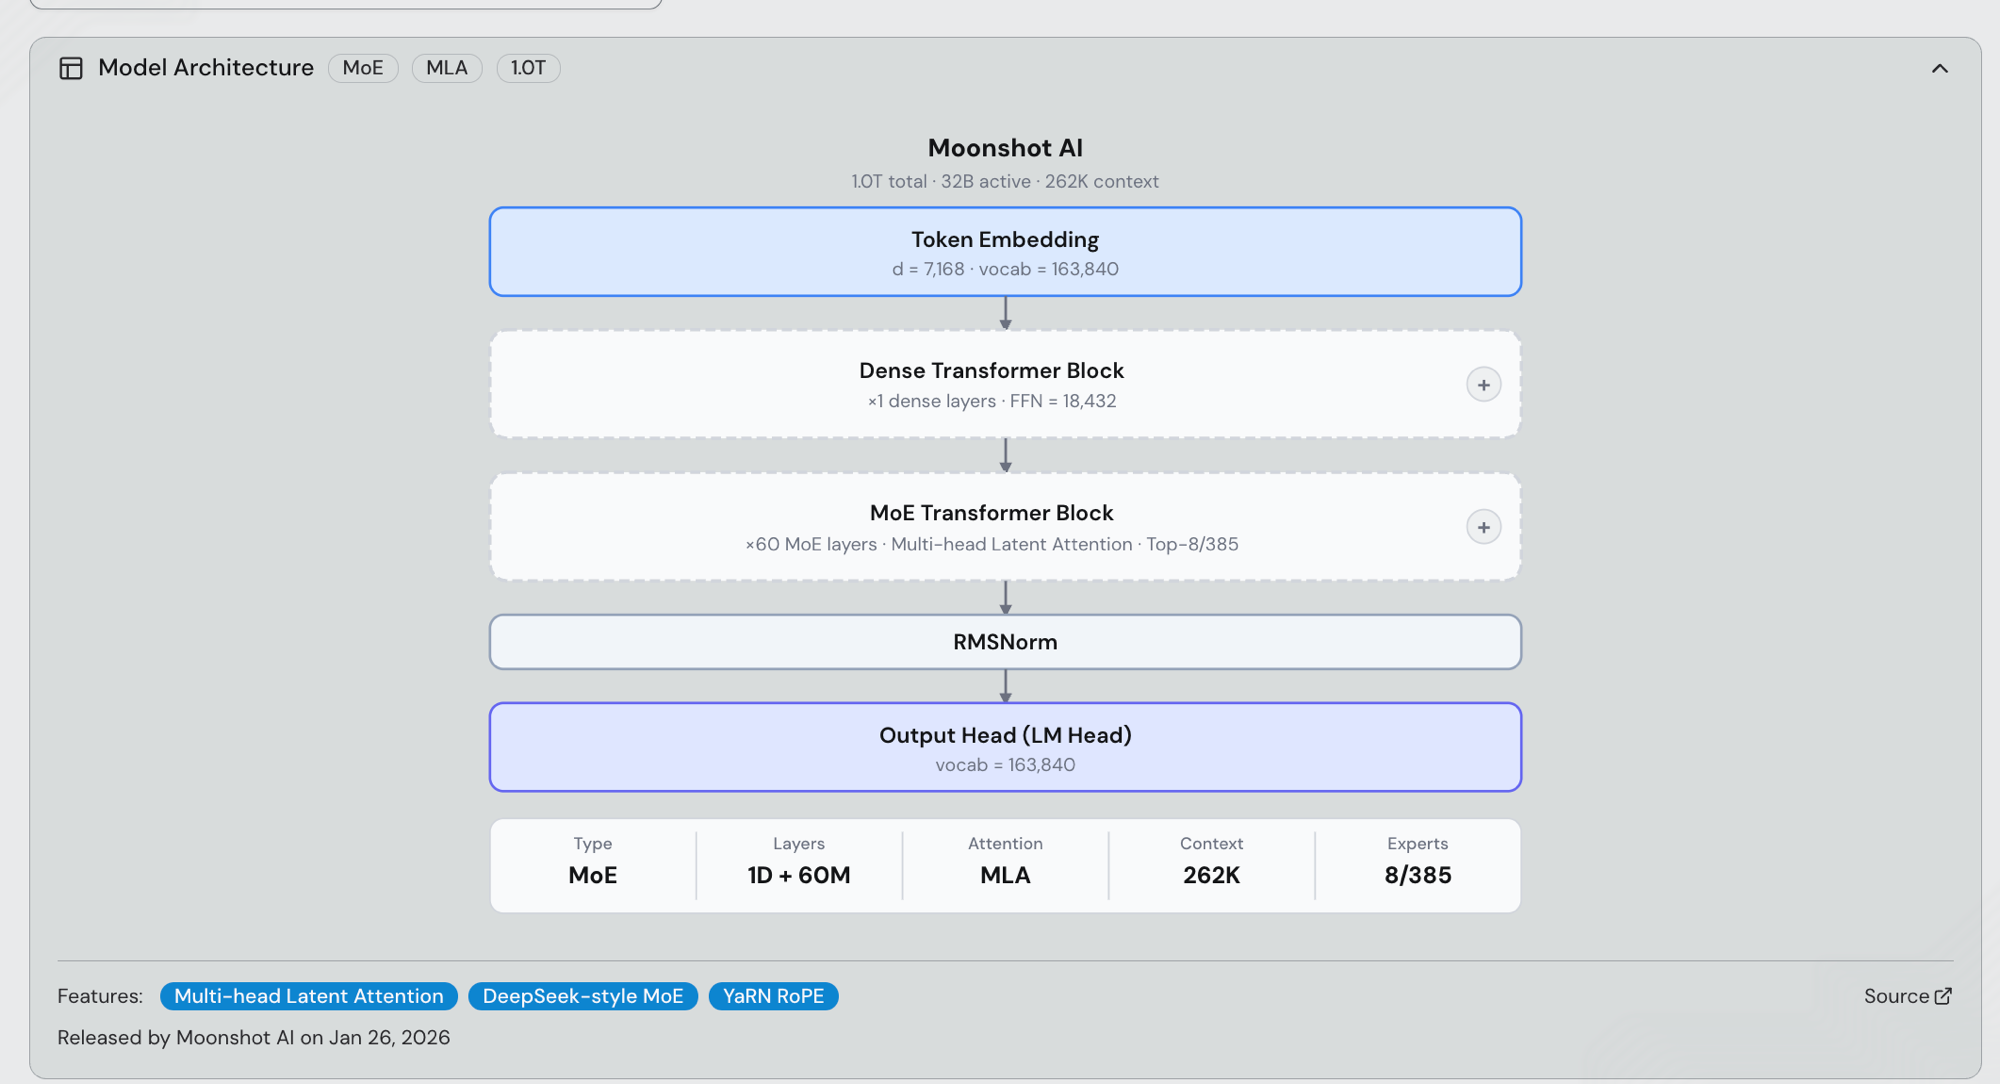
Kimi K2.5 / K2.6 Model Architecture & DownStream Cursor Composer 2.5 Model
Kimi K2.5 (released 2026-01-27) and Kimi K2.6 (released 2026-04-20) share the original Kimi K2 backbone: a 1.0T-parameter MoE with 32B activated per token, DeepSeek-style top-8-of-385 expert routing across 61 transformer layers (1 dense block + 60 MoE blocks), Multi-head Latent Attention (MLA), SwiGLU, YaRN RoPE, a 163,840-token vocabulary, and a 256K context window (262,144 tokens). The HF checkpoints are moonshotai/Kimi-K2.5 and moonshotai/Kimi-K2.6 — the two are post-training refinements on the same pre-trained architecture, so every serving result in this post applies one-to-one to both.
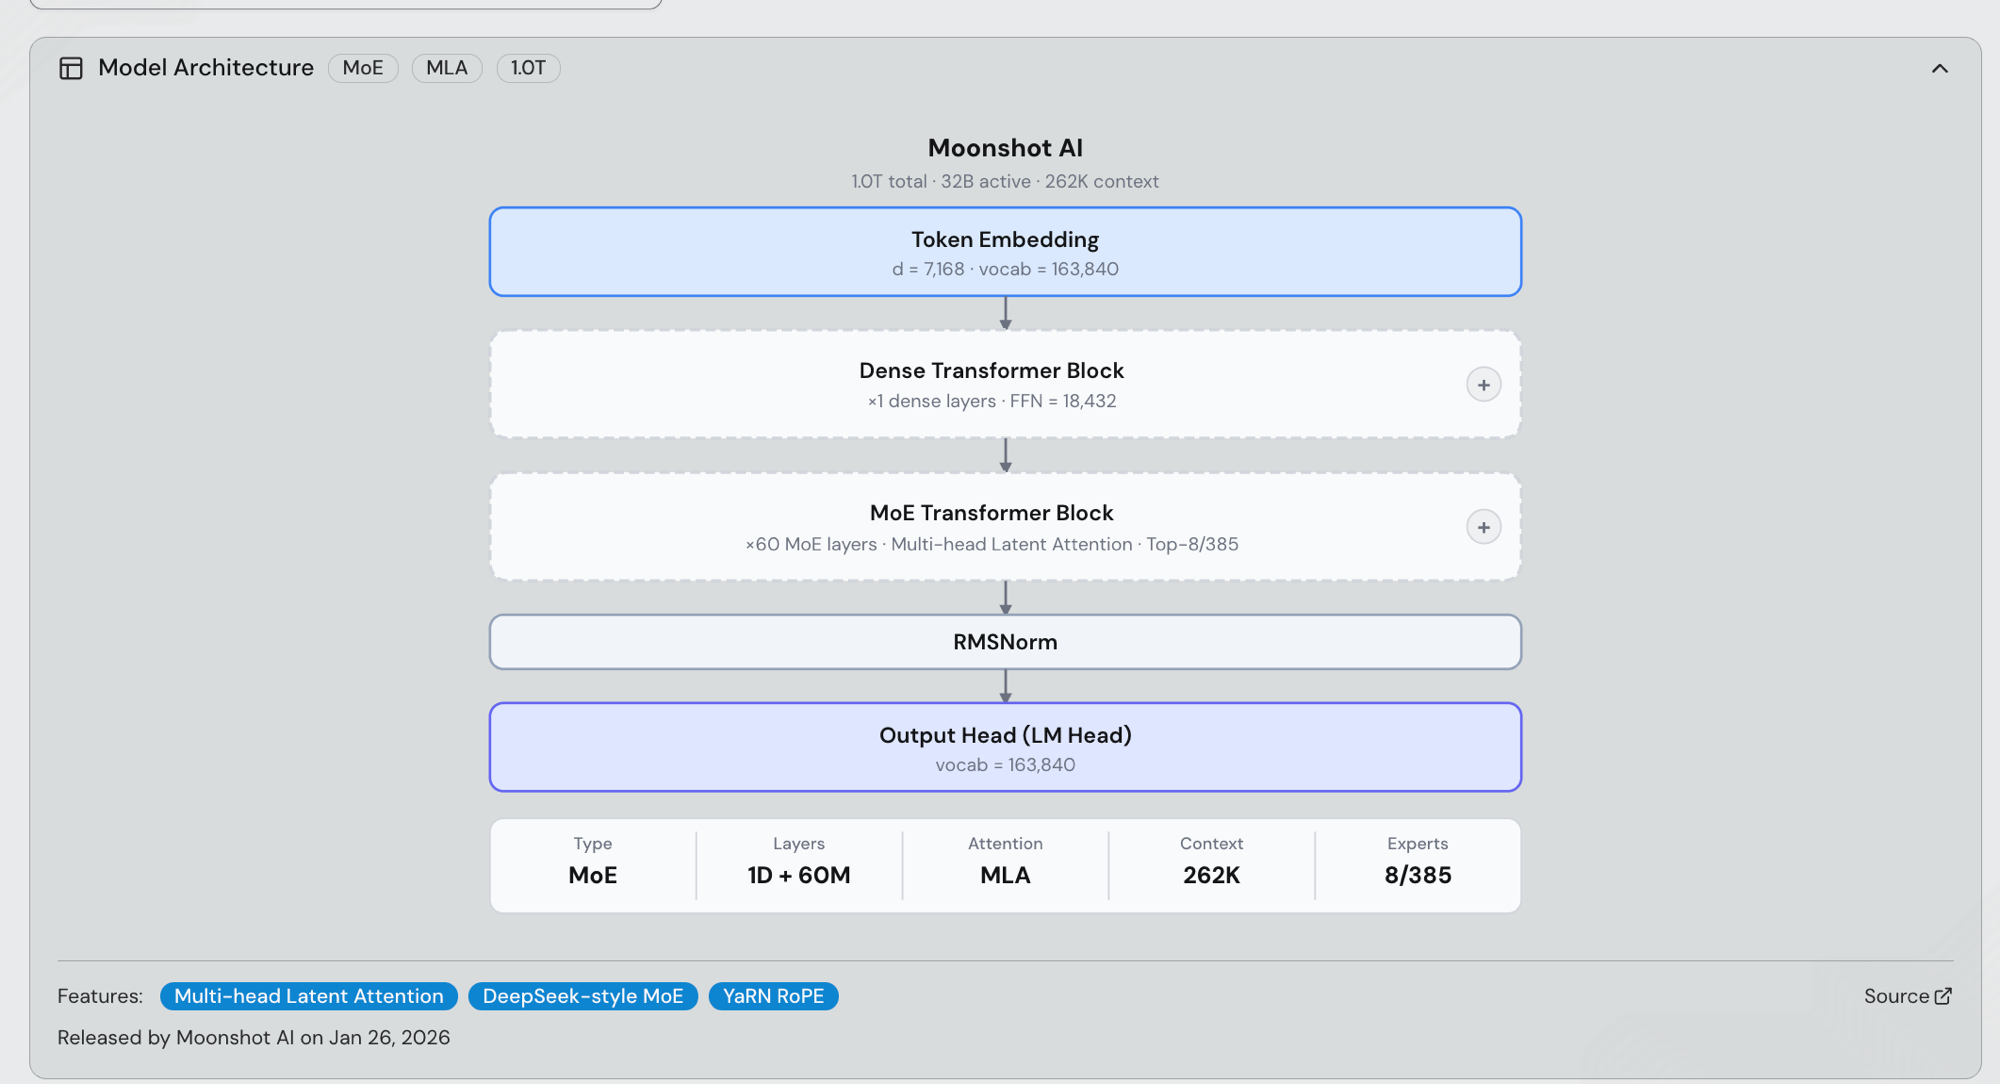
K2.5 and K2.6 are the open-weights models powering xAI's Cursor Composer 2 and Composer 2.5, serving 1M+ daily active users from the Cursor IDE. K2.6 also leads frontier models on the public agentic-coding benchmarks: 58.6% on SWE-Bench Pro — ahead of GPT-5.4 (57.7%), Claude Opus 4.6 (53.4%), and Gemini 3.1 Pro (54.2%) — and 80.2% on SWE-Bench Verified (Moonshot K2.6 model card). Cline's production deployment data puts it at 3.3% failure rate on complex diff-editing tasks, matching Claude 4 Sonnet. K2.6's Agent Swarm primitive fans out to 300 parallel sub-agents across 4,000 coordinated steps, up from K2.5's 100 / 1,500. If you're hosting an OSS agentic coding stack today, K2.5 or K2.6 is the model you're serving.
A note on quantization: Moonshot ships K2.5/K2.6 with native INT4 weights as the default open-weights checkpoint, which is what the H200 INT4 and B200 INT4 curves in this post use directly. The B200 NVFP4 curve uses a NVFP4 requantization of the same weights so B200's FP4 tensor cores can do the MoE GEMMs at full rate. H200 cannot run this path — Hopper SM90 has no FP4 tensor cores.
On-Paper Specs
NVIDIA B200 SXM (Blackwell, 2025) vs NVIDIA H200 SXM (Hopper, 2024) — both are NVIDIA, both run vLLM, both ship in 8-GPU NVLink islands. The radar below normalizes each axis to the cross-vendor maximum in /gpu-specs, so the visible polygons compress against axes where GB200 NVL72 / GB300 NVL72 set the ceiling (Scale Up Domain Memory + BW at world-size 72), and the FP4 axis is dominated by GB300 NVL72 at 15,000 TFLOP/s — B200's 9,000 TFLOP/s reads ~60% on that axis.
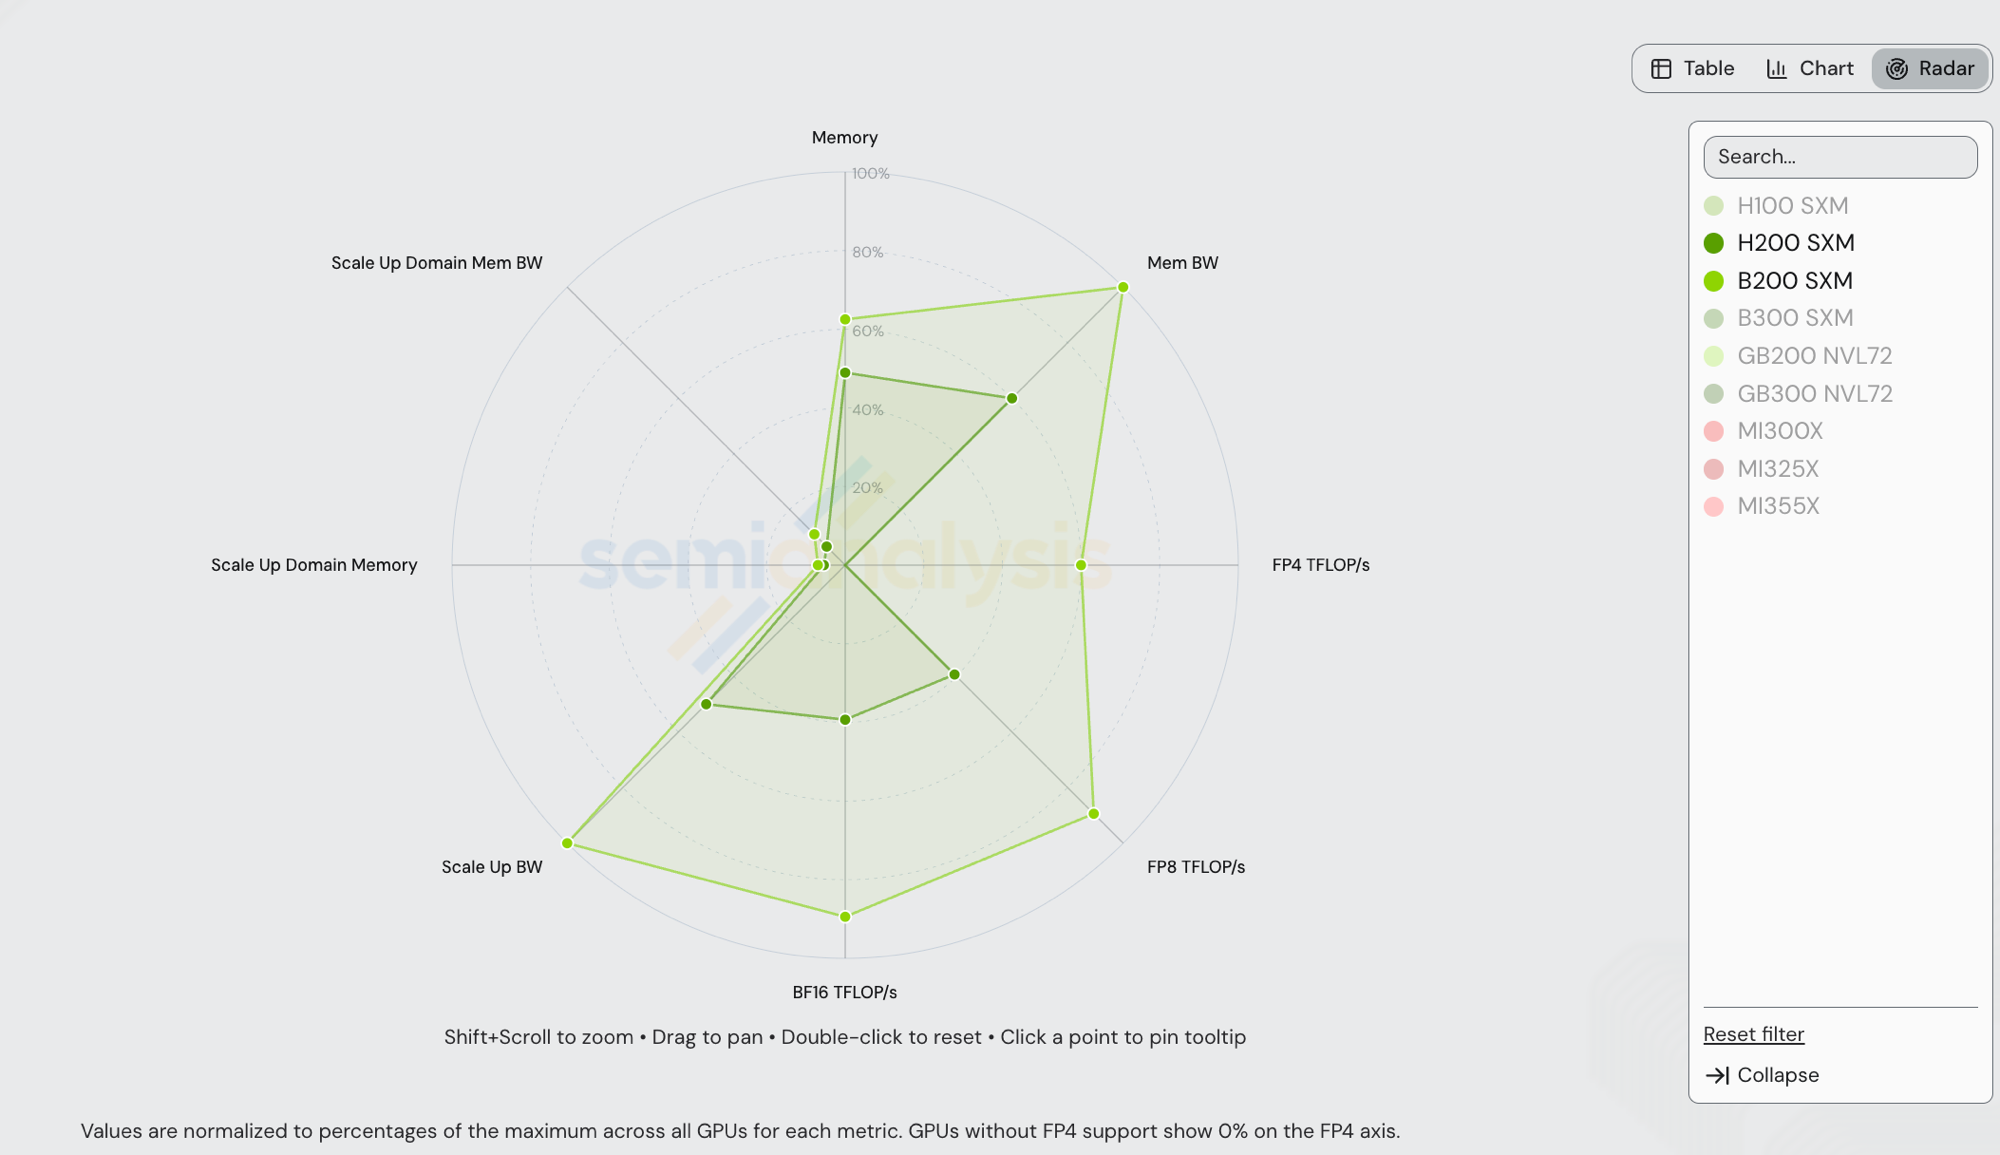
| Spec | H200 SXM | B200 SXM | B200 / H200 |
|---|---|---|---|
| HBM capacity | 141 GB | 180 GB | 1.28x |
| HBM bandwidth | 4.8 TB/s | 8 TB/s | 1.67x |
| Dense FP4 (TFLOP/s) | — (no FP4 cores) | 9,000 | ∞ |
| Dense FP8 (TFLOP/s) | 1,979 | 4,500 | 2.27x |
| Dense BF16 (TFLOP/s) | 989 | 2,250 | 2.27x |
| Scale-up BW per GPU (uni-di) | 450 GB/s (NVLink 4) | 900 GB/s (NVLink 5) | 2.00x |
| Scale-up world size | 8 | 8 | 1.00x |
| Scale-up domain HBM capacity | 1.13 TB | 1.44 TB | 1.28x |
| Scale-up domain HBM BW (aggregate) | 38.4 TB/s | 64 TB/s | 1.67x |
| TCO (SemiAnalysis AI Cloud Model) | $1.41/GPU/hr | $1.95/GPU/hr | 1.38x |
Mapping silicon to measured perf. When both SKUs run vLLM INT4 on the same model, the workload is bounded by HBM bandwidth on the decode path — each step streams the active expert weights through HBM, batched across in-flight users. B200's 1.67x HBM BW advantage shows up directly in the throughput: at iv = 26 tok/s/user, B200 INT4 hits 1,791 tok/s/GPU vs H200 INT4's interpolated 1,055 — a 1.70x ratio, sitting right at the silicon limit. After the 1.38x TCO penalty, B200 INT4 lands a 1.22x cost-per-token advantage over H200 INT4.
HBM capacity buys a second silicon win that doesn't show up in the radar: lower TP, less collective overhead per token. Kimi K2.5/K2.6 in INT4 weighs roughly 500 GB of live model state (1T total params at ~4 bits each, plus activations, KV cache, paged attention scratch). On B200's 180 GB per GPU, that fits in 4 GPUs (720 GB aggregate, ~30% headroom for KV cache and activations) → TP=4 is viable. On H200's 141 GB per GPU, the same model needs at least 8 GPUs (1,128 GB aggregate) to leave meaningful KV cache headroom → TP=8 is required. Every Pareto-winning B200 NVFP4 point in this post is TP=4; every measured H200 INT4 point is TP=8.
Halving the tensor-parallel world size halves the collective traffic per decode step — one fewer log₂N AllReduce hop on the attention output projection, on the MoE gather, and on the post-MLP reduce. Amdahl's law on the serial-collectives bottleneck pulls the per-step latency floor down. The B200 NVFP4 curve doesn't just sit above B200 INT4 by the precision ratio; it also pulls left on the interactivity axis because each decode step finishes sooner.
The precision unlock sits on top of both. Switching B200's path from INT4 to NVFP4 doubles its dense-tensor-core throughput — the path that does the bulk of MoE GEMMs in K2 — without re-paying for HBM. B200 NVFP4 hits 3,879 tok/s/GPU at 32 tok/s/user, 2.17x B200 INT4's peak at 26 tok/s/user. Compose the three factors — 1.67x HBM BW (decode-bound throughput floor) × ~2x NVFP4 (the precision unlock) × the TP=4-vs-TP=8 collectives win — and divide by the 1.38x TCO penalty. That lands at the measured 2.95x cost-per-million-tokens advantage at the headline interactivity point.
The Numbers
All rows are Kimi K2.5 / K2.6 at ISL 8192 / OSL 1024 on a single 8-GPU node, measured on InferenceX on 2026-05-19, GHA run 26118912054. Throughput is per-GPU. Cost per million tokens uses the SemiAnalysis AI Cloud TCO model: H200 at $1.41/GPU/hr, B200 at $1.95/GPU/hr. Formula: $/M tok = TCO\_$/GPU/hr × 1e6 / (3600 × tput_per_gpu).
H200 vLLM INT4 (TP=8) — the reference point:
| Conc | tok/s/GPU | tok/s/user | TPOT (ms) | $/M tokens |
|---|---|---|---|---|
| 4 | 384.4 | 91.18 | 10.97 | $1.019 |
| 8 | 590.2 | 70.28 | 14.23 | $0.664 |
| 16 | 797.9 | 46.64 | 21.44 | $0.491 |
| 32 | 990.9 | 28.86 | 34.65 | $0.395 |
| 64 | 1,174.5 | 16.67 | 59.98 | $0.334 |
B200 vLLM INT4 (TP=8) — the same precision on Blackwell silicon, isolating the silicon-only delta:
| Conc | tok/s/GPU | tok/s/user | TPOT (ms) | $/M tokens |
|---|---|---|---|---|
| 4 | 446.7 | 104.36 | 9.58 | $1.213 |
| 8 | 692.8 | 81.12 | 12.33 | $0.782 |
| 16 | 969.4 | 59.21 | 16.89 | $0.559 |
| 32 | 1,351.4 | 40.48 | 24.70 | $0.401 |
| 64 | 1,790.7 | 26.01 | 38.45 | $0.303 |
B200 vLLM NVFP4 (TP=4 + TP=8) — the headline-winning recipe; the dense Pareto-winning arm is TP=4 across all concurrencies, with one TP=8 conc=4 point extending the high-interactivity end:
| Conc | tok/s/GPU | tok/s/user | TPOT (ms) | $/M tokens | TP |
|---|---|---|---|---|---|
| 4 | 532.0 | 125.51 | 7.97 | $1.018 | TP=8 |
| 4 | 947.4 | 111.08 | 9.00 | $0.572 | TP=4 |
| 8 | 1,537.2 | 90.66 | 11.03 | $0.352 | TP=4 |
| 16 | 2,318.7 | 67.40 | 14.84 | $0.234 | TP=4 |
| 32 | 3,202.7 | 46.83 | 21.35 | $0.169 | TP=4 |
| 64 | 3,879.3 | 32.19 | 31.07 | $0.140 | TP=4 |
The bolded row is the headline: $0.140 per million tokens on B200 NVFP4 at 32 tok/s/user, the lowest serving cost on the chart.
Iso-Interactivity Cost Comparison
Cost per million tokens at matched interactivity, interpolated along each SKU's Pareto frontier. Cells outside a frontier's measured range render as _unreachable_ (and the ratio column as _∞_). The overlap range across all three curves is 30–90 tok/s/user — that's where the meaningful three-way comparison lives.
| Interactivity (tok/s/user) | H200 INT4 $/M | B200 INT4 $/M | B200 NVFP4 $/M | H200 / B200 NVFP4 | H200 / B200 INT4 | B200 INT4 / B200 NVFP4 |
|---|---|---|---|---|---|---|
| 32 | $0.413 | $0.343 | $0.140 | 2.95x | 1.20x | 2.45x |
| 35 | $0.427 | $0.362 | $0.145 | 2.95x | 1.18x | 2.50x |
| 40 | $0.453 | $0.397 | $0.154 | 2.94x | 1.14x | 2.58x |
| 50 | $0.511 | $0.477 | $0.177 | 2.88x | 1.07x | 2.69x |
| 60 | $0.569 | $0.566 | $0.206 | 2.75x | 1.00x | 2.74x |
| 70 | $0.660 | $0.655 | $0.244 | 2.71x | 1.01x | 2.69x |
| 80 | $0.811 | $0.766 | $0.286 | 2.84x | 1.06x | 2.68x |
| 90 | $0.996 | $0.927 | $0.347 | 2.87x | 1.07x | 2.67x |
| 100 | unreachable | $1.123 | $0.421 | ∞ | unreachable | 2.67x |
| 110 | unreachable | unreachable | $0.550 | ∞ | ∞ | ∞ |
| 125 | unreachable | unreachable | $1.000 | ∞ | ∞ | ∞ |
The B200 NVFP4 vs H200 INT4 gap is flat across the overlap: 2.71x–2.95x from 30 to 90 tok/s/user. Both ends of the curve get the same advantage. At the low-interactivity / high-batch end, the workload is decode-bound and B200's HBM bandwidth + NVFP4 tensor cores both stay saturated. At the high-interactivity / low-batch end, NVFP4 keeps reducing per-token compute as the batch shrinks. The same-precision row (H200 INT4 vs B200 INT4) tells a different story: it narrows to 1.00x–1.07x at 60–80 tok/s/user, where B200's silicon advantage just about pays for its TCO premium. The precision unlock is what carries the headline.
Above 100 tok/s/user, only B200 NVFP4 has a recipe at all. H200 INT4's frontier ends at 91 tok/s/user (conc=4 saturates per-step compute); B200 INT4 ends at 104. B200 NVFP4 still serves out to 125 tok/s/user at $1.00/M — a regime neither Hopper recipe reaches.
Live chart, pre-filtered to B200 + H200 vLLM Kimi K2.5/K2.6 across FP4 and INT4 on the same 2026-05-19 run.
Acknowledgments
Kimi K2.5 and K2.6 are the work of Moonshot AI, with weights at moonshotai/Kimi-K2.5 and moonshotai/Kimi-K2.6. The vLLM NVFP4 path on Blackwell is the work of the vLLM project and NVIDIA's TensorRT-LLM / AITER kernel teams whose FP4 MoE kernels vLLM links against. Continuous benchmarking by SemiAnalysis on InferenceX. Speed is the moat.
All articles and posts are © SemiAnalysis. All rights reserved. The AGPL-3.0 license covering the application source code does not apply to article content.