B300 FP8: MTP vs Off Speculative Decoding
Speculative decoding comparison of MTP versus Off on B300 FP8 (NVIDIA Blackwell) running GLM 5/5.1. Throughput, cost, and interactivity differences across LLM workloads. Use the chart controls below to switch sequences and metrics — same interactions as the main inference chart.
MTP acceptance-rate implementations differ across inference engines. Points from different engines are not directly comparable on the same curve — throughput and cost at matched interactivity may reflect engine-level differences rather than pure speculative decoding gains. Interpret cross-engine comparisons with caution.
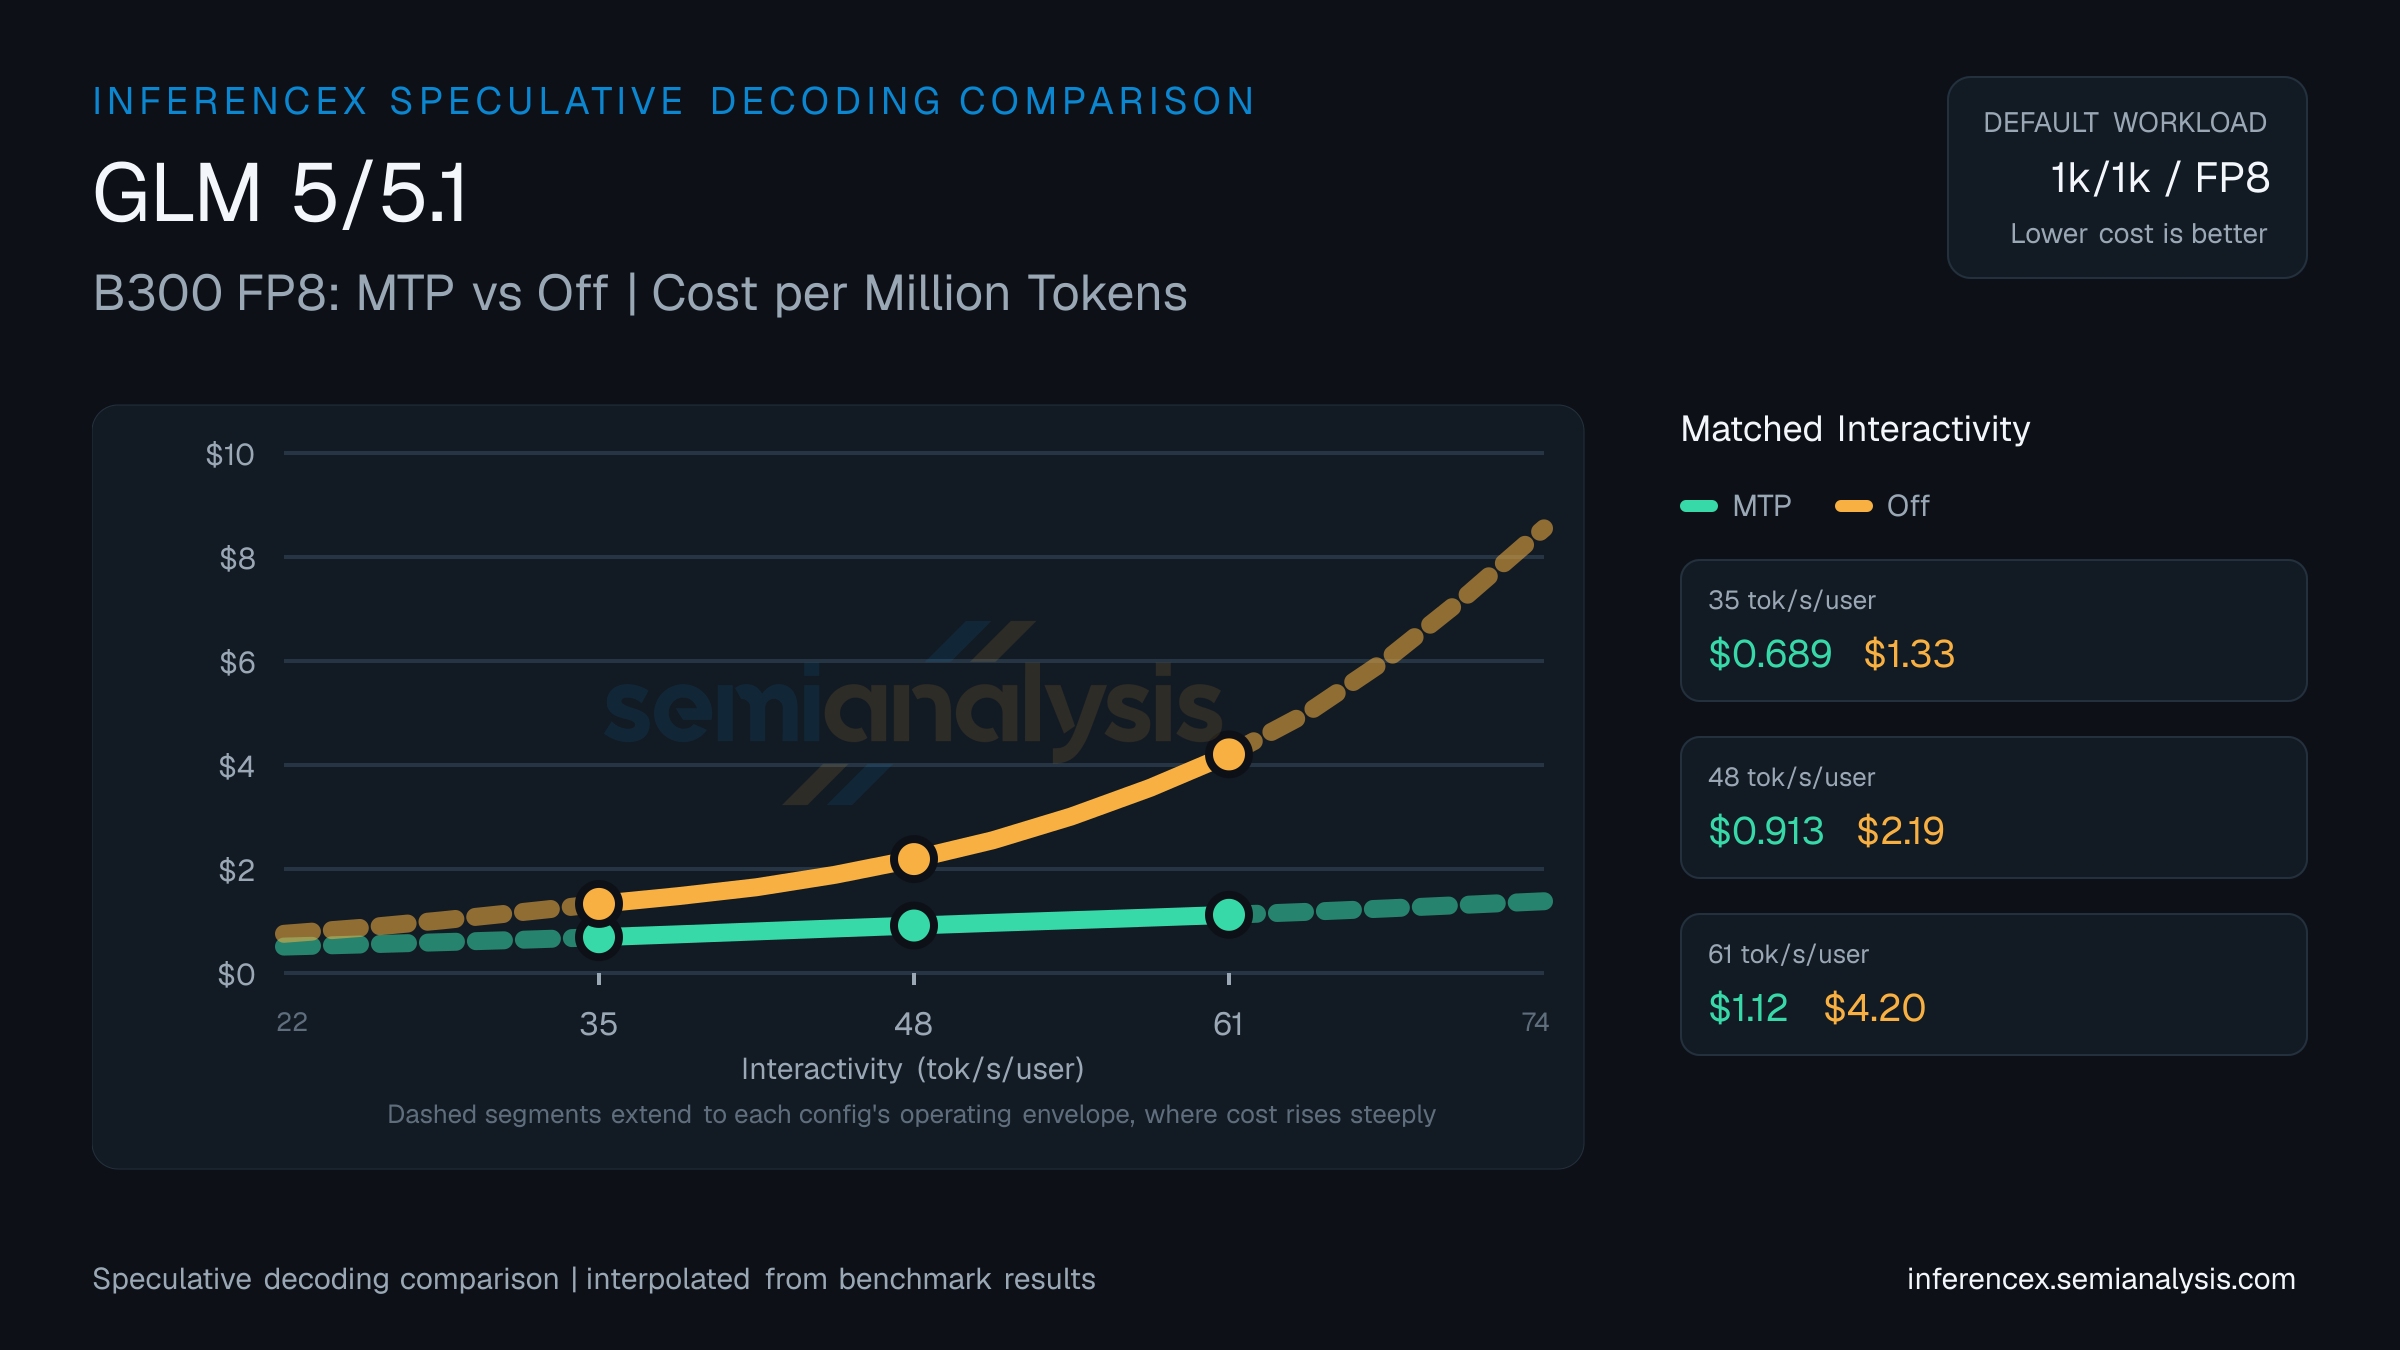
Near the low end of the 22–74 tok/s/user interactivity band, at 35 tok/s/user on GLM 5/5.1 (B300 FP8): MTP runs 944 tok/s/GPU at $0.69/M tokens, Off runs 486 at $1.33/M. MTP is 93% cheaper per token; MTP delivers 94% more tok/s/GPU. Gains from speculative decoding vary by workload; short-output prompts tend to benefit less.
At 48 tok/s/user on GLM 5/5.1 (B300 FP8), MTP delivers 711 tok/s/GPU at $0.91 per million tokens; Off delivers 298 tok/s/GPU at $2.19. MTP is 140% cheaper per token; MTP delivers 138% more tok/s/GPU. Speculative decoding accepts draft tokens to reduce per-token latency — gains vary by workload and prompt distribution.
MTP posts 576 tok/s/GPU for $1.12 per million tokens at 61 tok/s/user on GLM 5/5.1 (B300 FP8); Off posts 154 tok/s/GPU for $4.20. MTP is 276% cheaper per token; MTP delivers 273% more tok/s/GPU. Draft-token acceptance rates determine whether speculative decoding helps or hurts at a given concurrency level. (Numbers reflect this URL's pinned 1k/1k · fp8 workload — changing sequence or model updates both the table and chart; the table stays pinned to this page's precision, so precision toggles in the controls affect the chart only.)
| Metric | Interactivity (tok/s/user) | Interactivity (tok/s/user) | Interactivity (tok/s/user) |
|---|---|---|---|
| Throughput (tok/s/gpu) | MTP:944.3Off:486.1 | MTP:710.7Off:298.4 | MTP:575.9Off:154.3 |
| Cost ($/M tok) | MTP:$0.689Off:$1.329 | MTP:$0.913Off:$2.191 | MTP:$1.119Off:$4.204 |
| tok/s/MW | MTP:435143Off:224016 | MTP:327495Off:137518 | MTP:265399Off:71124 |
| Concurrency | MTP:~109Off:~57 | MTP:~61Off:~25 | MTP:~39Off:~10 |
Inference Performance
Inference performance metrics across different models, hardware configurations, and serving parameters.