B200 FP8: MTP vs Off Speculative Decoding
Speculative decoding comparison of MTP versus Off on B200 FP8 (NVIDIA Blackwell) running GLM 5/5.1. Throughput, cost, and interactivity differences across LLM workloads. Use the chart controls below to switch sequences and metrics — same interactions as the main inference chart.
MTP acceptance-rate implementations differ across inference engines. Points from different engines are not directly comparable on the same curve — throughput and cost at matched interactivity may reflect engine-level differences rather than pure speculative decoding gains. Interpret cross-engine comparisons with caution.
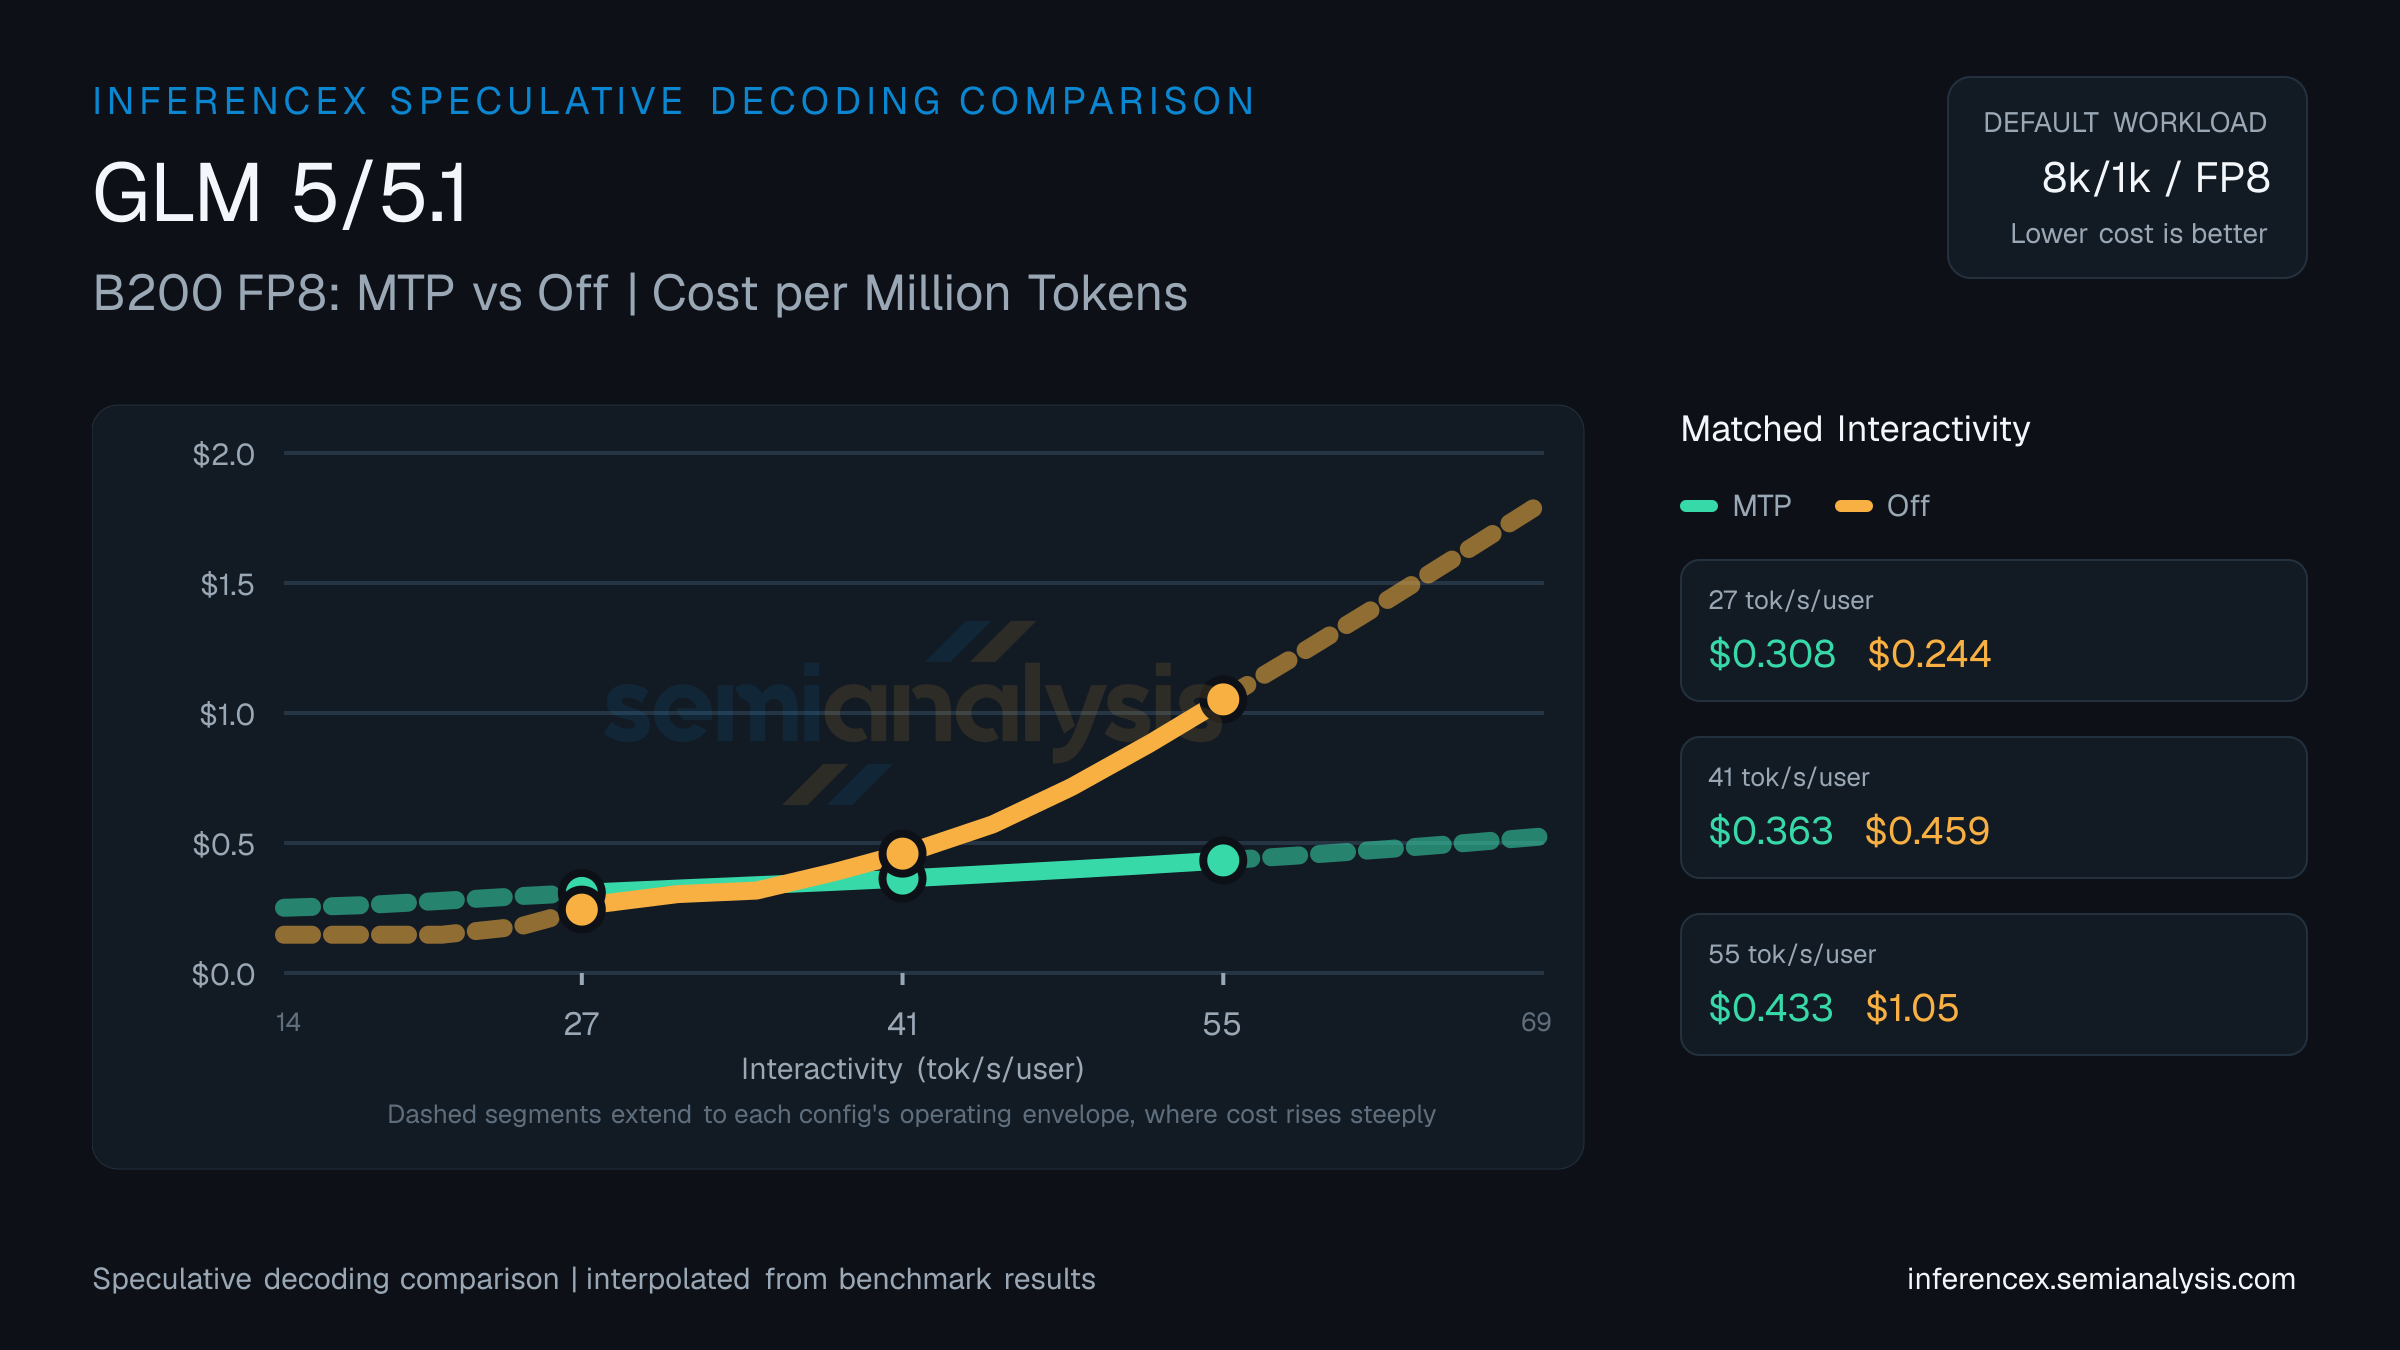
At 27 tok/s/user on GLM 5/5.1 (B200 FP8), MTP delivers 1757 tok/s/GPU at $0.31 per million tokens; Off delivers 2246 tok/s/GPU at $0.24. Off is 26% cheaper per token; Off delivers 28% more tok/s/GPU. Speculative decoding accepts draft tokens to reduce per-token latency — gains vary by workload and prompt distribution.
MTP posts 1491 tok/s/GPU for $0.36 per million tokens at 41 tok/s/user on GLM 5/5.1 (B200 FP8); Off posts 1174 tok/s/GPU for $0.46. MTP is 26% cheaper per token; MTP delivers 27% more tok/s/GPU. Draft-token acceptance rates determine whether speculative decoding helps or hurts at a given concurrency level.
Throughput at 55 tok/s/user on GLM 5/5.1 (B200 FP8): MTP hits 1249 tok/s/GPU, Off hits 520. Per-million costs land at $0.43 and $1.05 respectively. MTP is 143% cheaper per token; MTP delivers 140% more tok/s/GPU. Speculative decoding trades extra compute on draft tokens for fewer decoding steps — the payoff depends on sequence length and batch size. (Numbers reflect this URL's pinned 8k/1k · fp8 workload — changing sequence or model updates both the table and chart; the table stays pinned to this page's precision, so precision toggles in the controls affect the chart only.)
| Metric | Interactivity (tok/s/user) | Interactivity (tok/s/user) | Interactivity (tok/s/user) |
|---|---|---|---|
| Throughput (tok/s/gpu) | MTP:1756.9Off:2246.3 | MTP:1490.8Off:1174.4 | MTP:1249.0Off:520.3 |
| Cost ($/M tok) | MTP:$0.308Off:$0.244 | MTP:$0.363Off:$0.459 | MTP:$0.433Off:$1.052 |
| tok/s/MW | MTP:809639Off:1035153 | MTP:687025Off:541195 | MTP:575556Off:239773 |
| Concurrency | MTP:~60Off:~229 | MTP:~34Off:~244 | MTP:~21Off:~15 |
Inference Performance
Inference performance metrics across different models, hardware configurations, and serving parameters.