
GB300 NVL72: FP4 vs FP8 Precision Comparison
How FP4 and FP8 precision affect MiniMax M2.5/M2.7 inference on GB300 NVL72 (NVIDIA Blackwell). Throughput, latency, and cost across LLM workloads. Use the chart controls below to switch sequences and metrics — same interactions as the main inference chart.
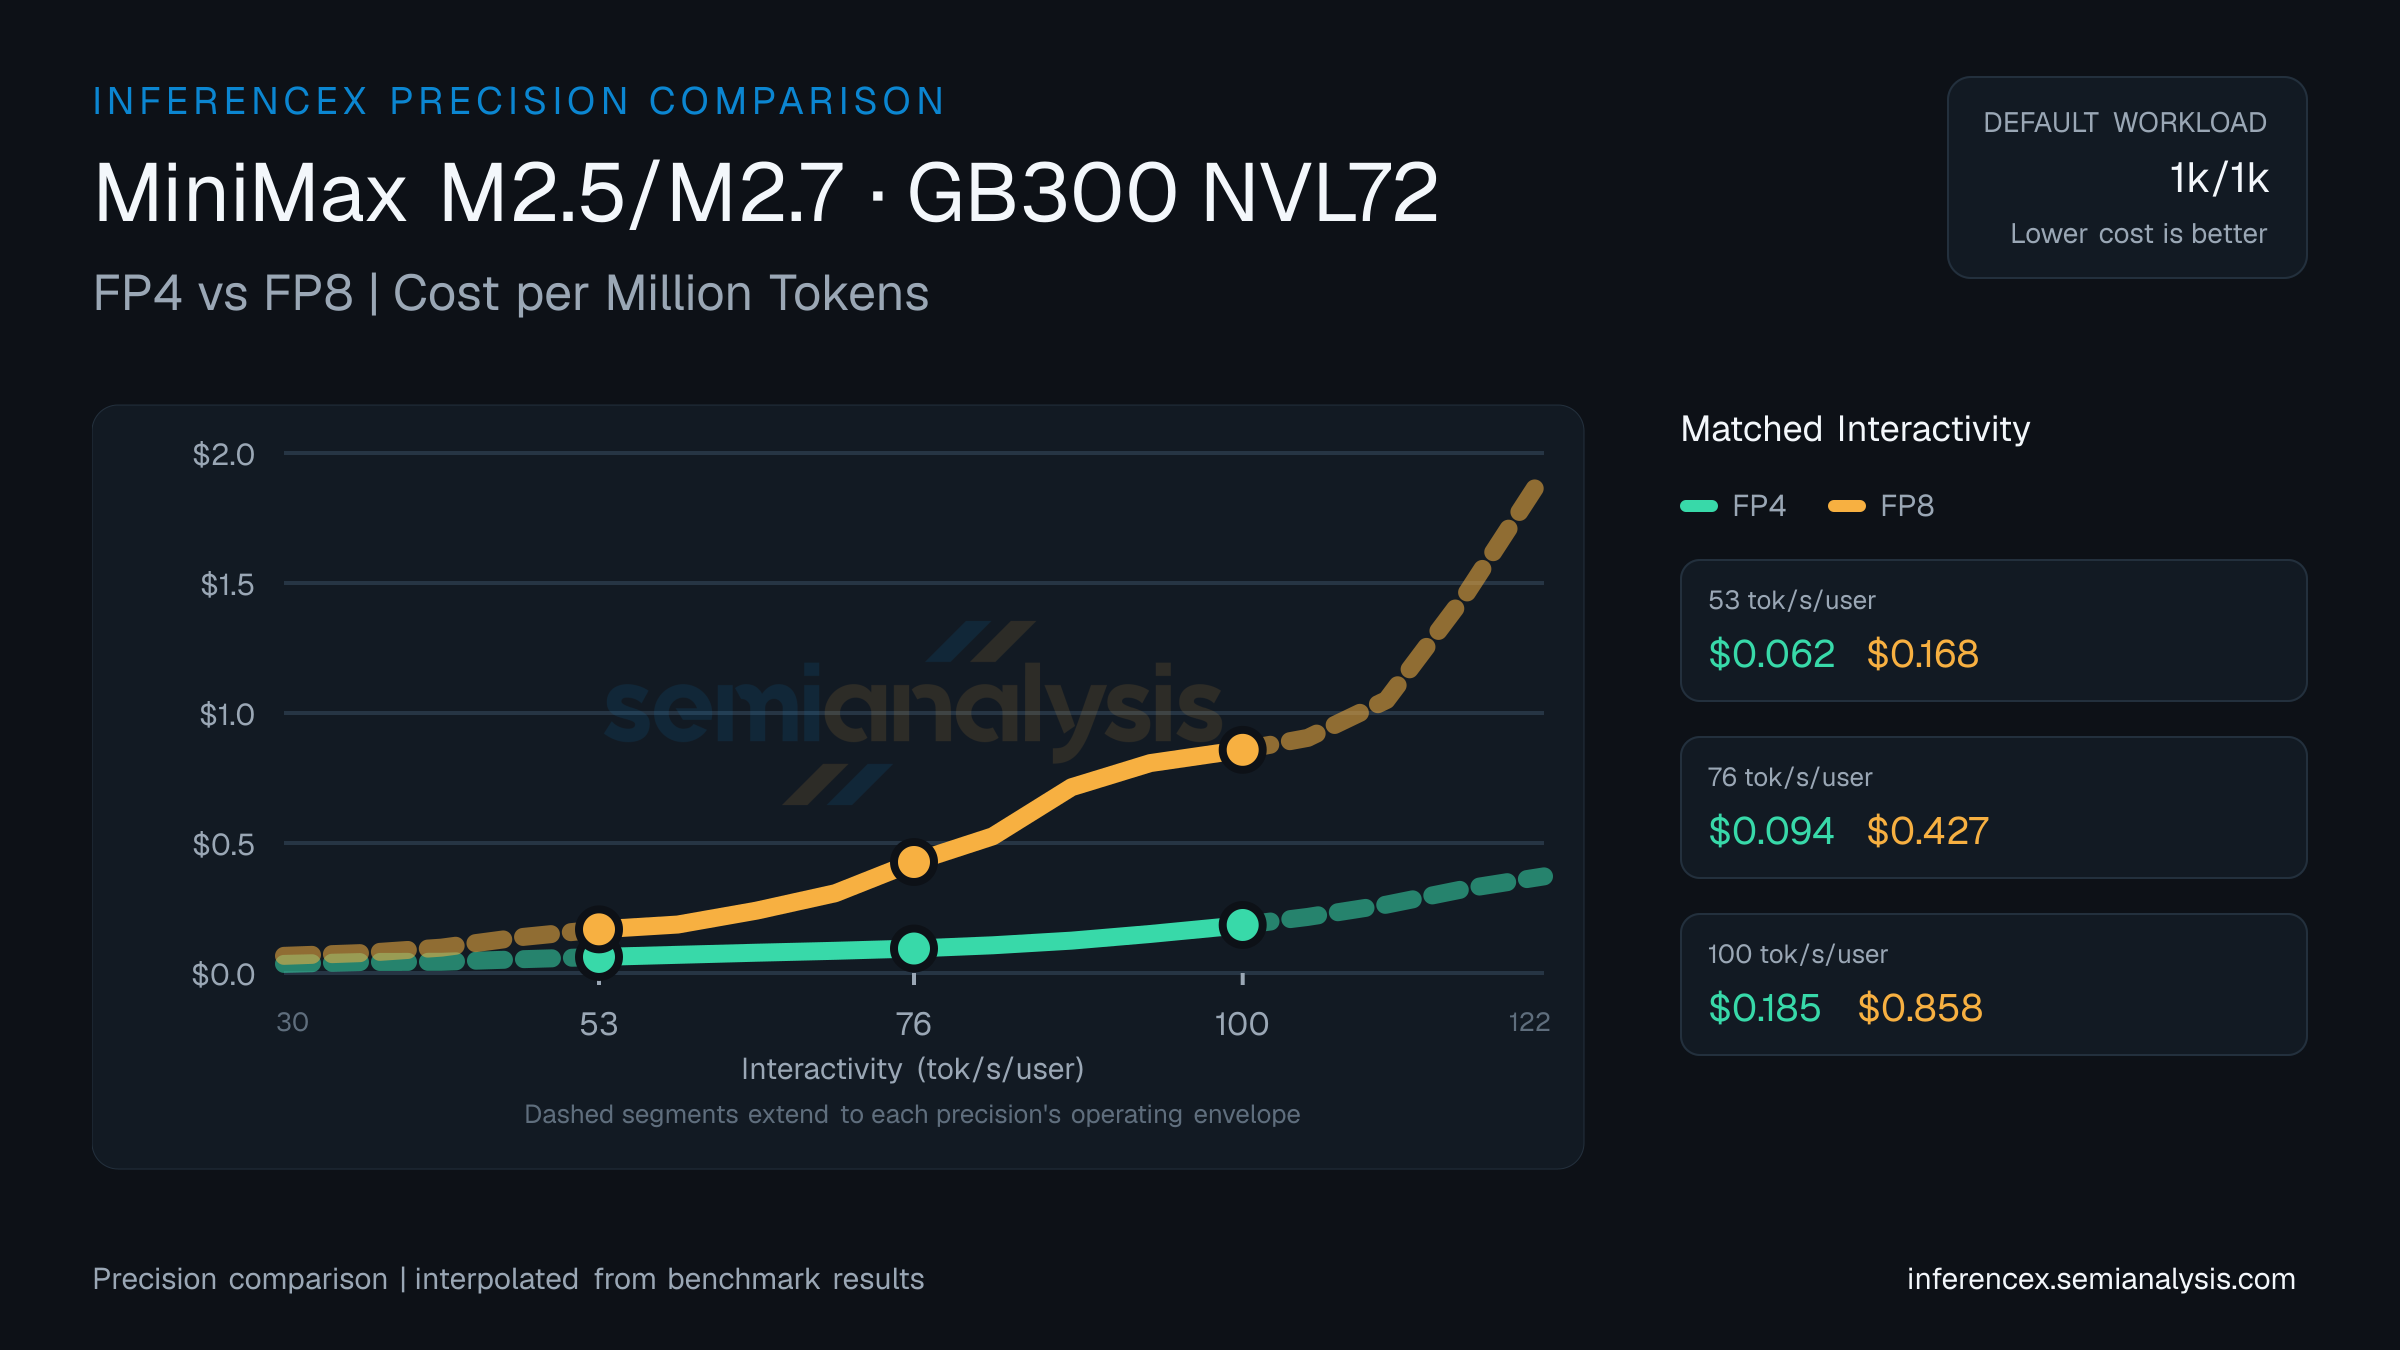
Near the low end of the 30–122 tok/s/user interactivity band, at 53 tok/s/user on MiniMax M2.5/M2.7 (GB300 NVL72): FP4 runs 12145 tok/s/chip at $0.05/M tokens, FP8 runs 4368 at $0.15/M. FP4 is 178% cheaper per token; FP4 delivers 178% more tok/s/chip. Precision changes affect both inference speed and model quality — consult the evaluation tab for accuracy benchmarks.
At 76 tok/s/user on MiniMax M2.5/M2.7 (GB300 NVL72), FP4 delivers 7589 tok/s/chip at $0.08 per million tokens; FP8 delivers 1760 tok/s/chip at $0.36. FP4 is 331% cheaper per token; FP4 delivers 331% more tok/s/chip. Lower-precision quantization trades model accuracy for throughput — check the evaluation page for quality impact.
FP4 posts 3983 tok/s/chip for $0.16 per million tokens at 100 tok/s/user on MiniMax M2.5/M2.7 (GB300 NVL72); FP8 posts 887 tok/s/chip for $0.72. FP4 is 349% cheaper per token; FP4 delivers 349% more tok/s/chip. Quantization-level accuracy differences are tracked on the evaluation tab. (Numbers reflect the default 1k/1k selection for this URL — table and chart below update if you change sequence or model in the controls. Each side uses the best available serving configuration for that precision, which may include speculative decoding such as MTP where recipes exist — the same convention as the other comparison pages.)
| Metric | Interactivity (tok/s/user) | Interactivity (tok/s/user) | Interactivity (tok/s/user) |
|---|---|---|---|
| Throughput (tok/s/chip) | FP4:12144.7FP8:4368.4 | FP4:7588.8FP8:1760.1 | FP4:3982.7FP8:886.8 |
| Cost ($/M tok) | FP4:$0.053FP8:$0.147 | FP4:$0.085FP8:$0.365 | FP4:$0.161FP8:$0.724 |
| tok/s/MW | FP4:5728652FP8:2060561 | FP4:3579613FP8:830251 | FP4:1878642FP8:418299 |
| Concurrency | FP4:~1143FP8:~500 | FP4:~1024FP8:~64 | FP4:~229FP8:~32 |
Inference Performance
Agentic inference metrics from the AgentX scenario and fixed-sequence inference metrics across models, hardware configurations, and serving parameters.