MiniMax M3.1 Flash 428B · Performance per dollar
MiniMax M3.1 Flash 428B — H100 vs Vera Rubin NVL72 performance per dollar
Cost per million tokens of H100 (NVIDIA Hopper) versus Vera Rubin NVL72 (NVIDIA Vera Rubin) on MiniMax M3.1 Flash 428B. Large-hyperscaler-volume ownership TCO normalized by total tokens — performance per dollar across LLM workloads. Pick the more cost-efficient SKU at every target interactivity level. Use the chart controls below to switch sequences, precisions, and metrics — same interactions as the main inference chart.
AgentX replays real coding-agent sessions rather than fixed-length prompts, so context grows turn over turn and most of each request is served from cache instead of being recomputed. That turns the comparison into a systems question: KV transfer between nodes, prefix-aware routing, and cache capacity all move the curve alongside raw chip throughput. Fixed-sequence workloads stay the clean baseline for kernel and silicon performance, so the two scenarios answer different questions about the same hardware. Learn more about AgentX →
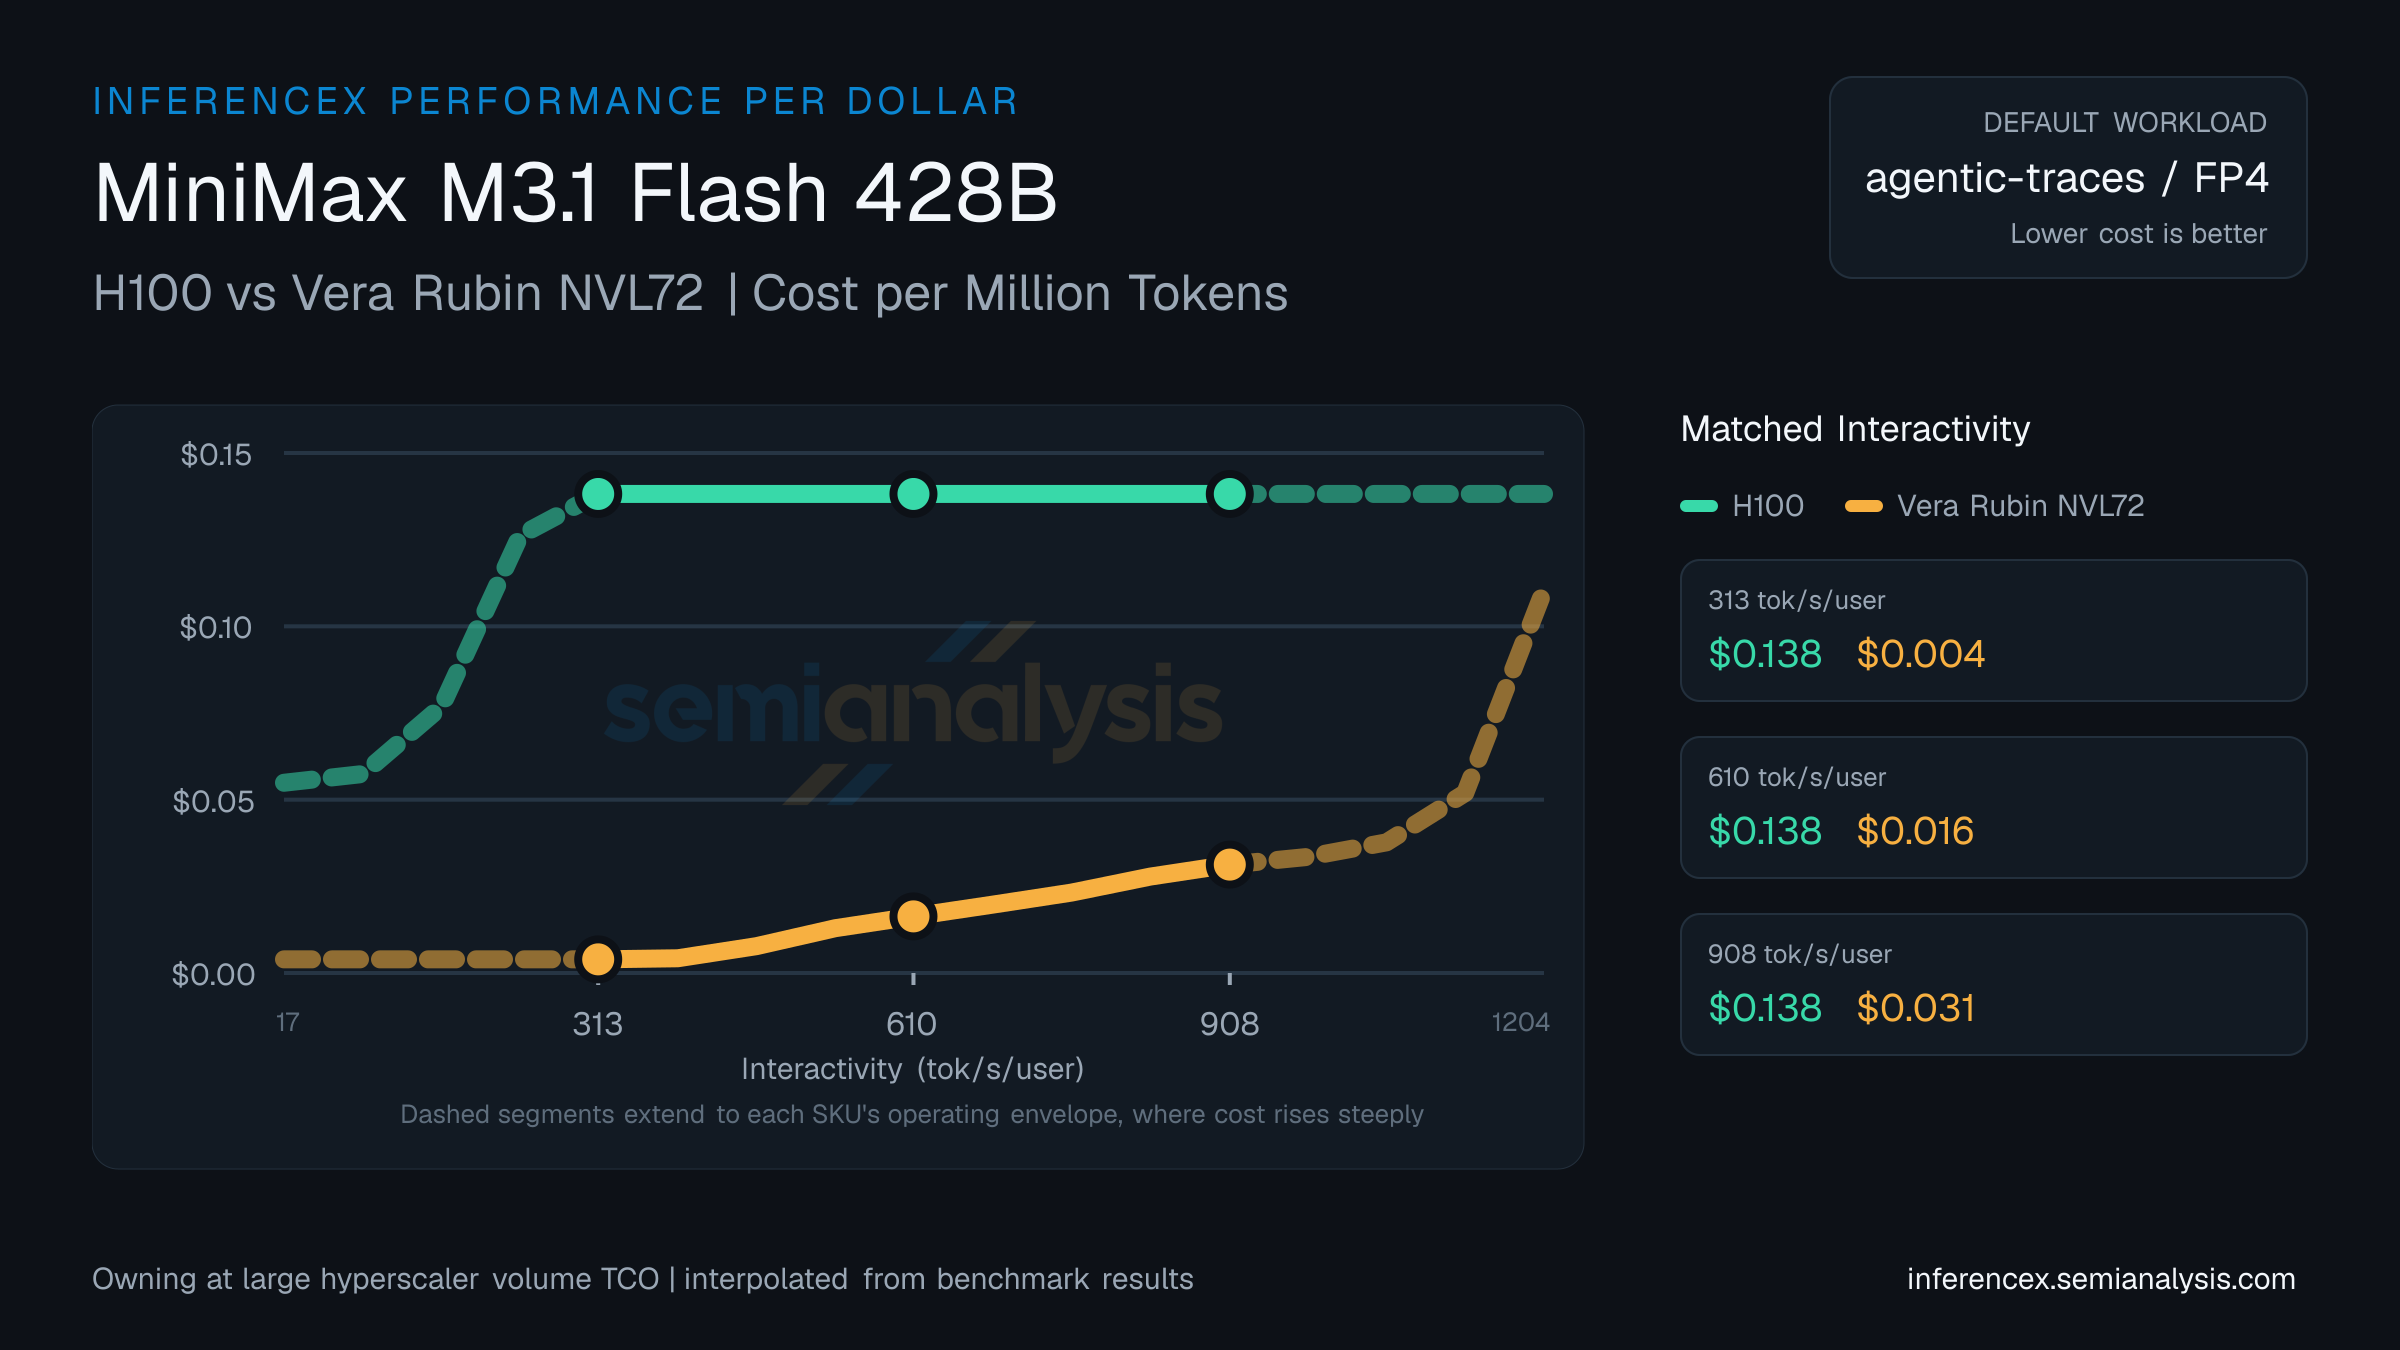
Near the low end of the 17–1204 tok/s/user interactivity band — at 313 tok/s/user — H100 runs $0.14 per million tokens on MiniMax M3.1 Flash 428B while Vera Rubin NVL72 runs $0.004. Vera Rubin NVL72 is the cheaper choice by 97%.
On MiniMax M3.1 Flash 428B at 610 tok/s/user, the per-million math comes out to $0.14 for H100 and $0.016 for Vera Rubin NVL72; Vera Rubin NVL72 delivers 8.5× the total tokens per dollar.
At 908 tok/s/user on MiniMax M3.1 Flash 428B, H100 costs $0.14 per million tokens; Vera Rubin NVL72 costs $0.031. Vera Rubin NVL72 delivers 4.4× the tokens per dollar at this operating point. (Numbers reflect the default agentic-traces · fp4 selection for this URL — table and chart below update if you change sequence, precision, or model in the controls.)
Chip pricing (owning hyperscaler): H100 $1.17/chip/hr · Vera Rubin NVL72 $3.61/chip/hr. Source: SemiAnalysis Market July 2026 Pricing Surveys & AI Cloud TCO Model.
Interpolated from real benchmark data. Edit target interactivity values below to compare at different operating points.
| Metric | Interactivity (tok/s/user) | Interactivity (tok/s/user) | Interactivity (tok/s/user) |
|---|---|---|---|
| Dollars per million tokens | H100$0.14Vera Rubin NVL72$0.004 | H100$0.14Vera Rubin NVL72$0.016 | H100$0.14Vera Rubin NVL72$0.031 |
| Concurrency | H100~1Vera Rubin NVL72~640 | H100~1Vera Rubin NVL72~61 | H100~1Vera Rubin NVL72~11 |