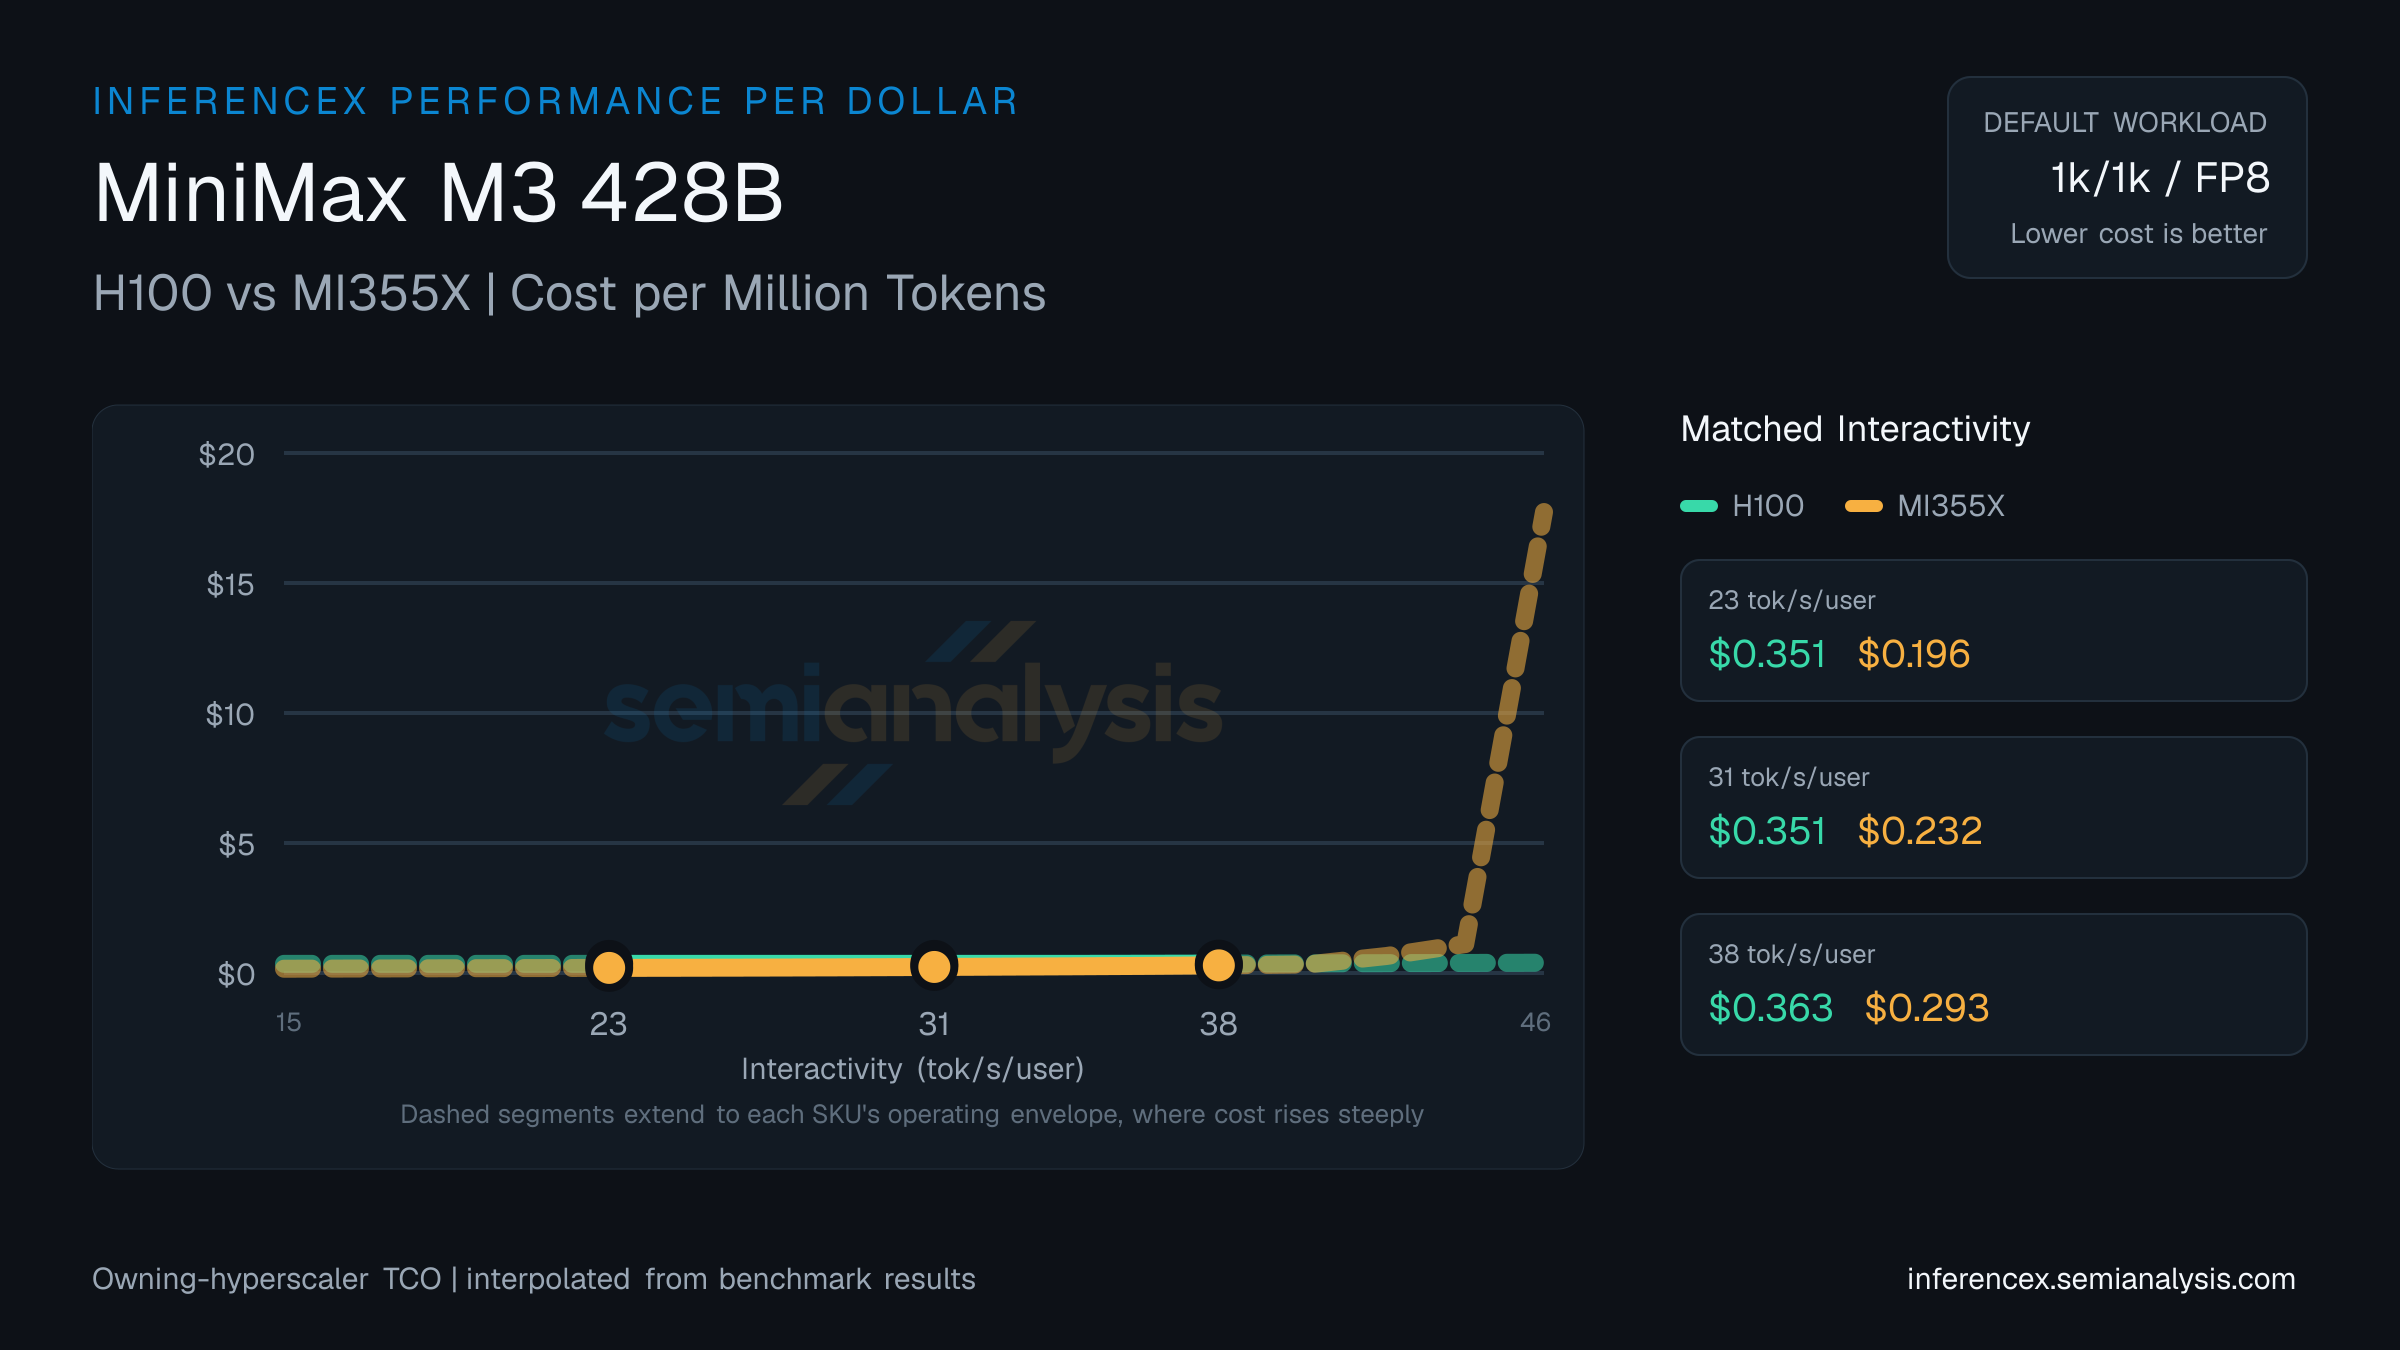
MiniMax M3 428B — H100 vs MI355X Performance per Dollar
Cost per million tokens of H100 (NVIDIA Hopper) versus MI355X (AMD CDNA 4) on MiniMax M3 428B. Owning-hyperscaler TCO normalized by output tokens — performance per dollar across LLM workloads. Pick the more cost-efficient SKU at every target interactivity level. Use the chart controls below to switch sequences, precisions, and metrics — same interactions as the main inference chart.
H100: $0.36 per million tokens. MI355X: $0.09. Both at 75 tok/s/user on MiniMax M3 428B, with MI355X 302% cheaper.
Around the middle of the 22–235 tok/s/user interactivity band — at 129 tok/s/user — H100 runs $0.51 per million tokens on MiniMax M3 428B while MI355X runs $0.14. MI355X is the cheaper choice by 265%.
On MiniMax M3 428B at 182 tok/s/user, the per-million math comes out to $0.67 for H100 and $0.23 for MI355X; MI355X delivers 190% more output per dollar. (Numbers reflect the default 8k/1k · fp8 selection for this URL — table and chart below update if you change sequence, precision, or model in the controls.)
GPU pricing (owning hyperscaler): H100 $1.30/GPU/hr · MI355X $1.48/GPU/hr. Source: SemiAnalysis Market August 2025 Pricing Surveys & AI Cloud TCO Model.
| Metric | Interactivity (tok/s/user) | Interactivity (tok/s/user) | Interactivity (tok/s/user) |
|---|---|---|---|
| Dollar per Million Tokens | H100:$0.365MI355X:$0.091 | H100:$0.513MI355X:$0.140 | H100:$0.669MI355X:$0.230 |
| Concurrency | H100:~13MI355X:~33 | H100:~6MI355X:~12 | H100:~3MI355X:~5 |
Inference Performance
Inference performance metrics across different models, hardware configurations, and serving parameters.