MiniMax M3 428B — B200 vs MI300X Performance per Dollar
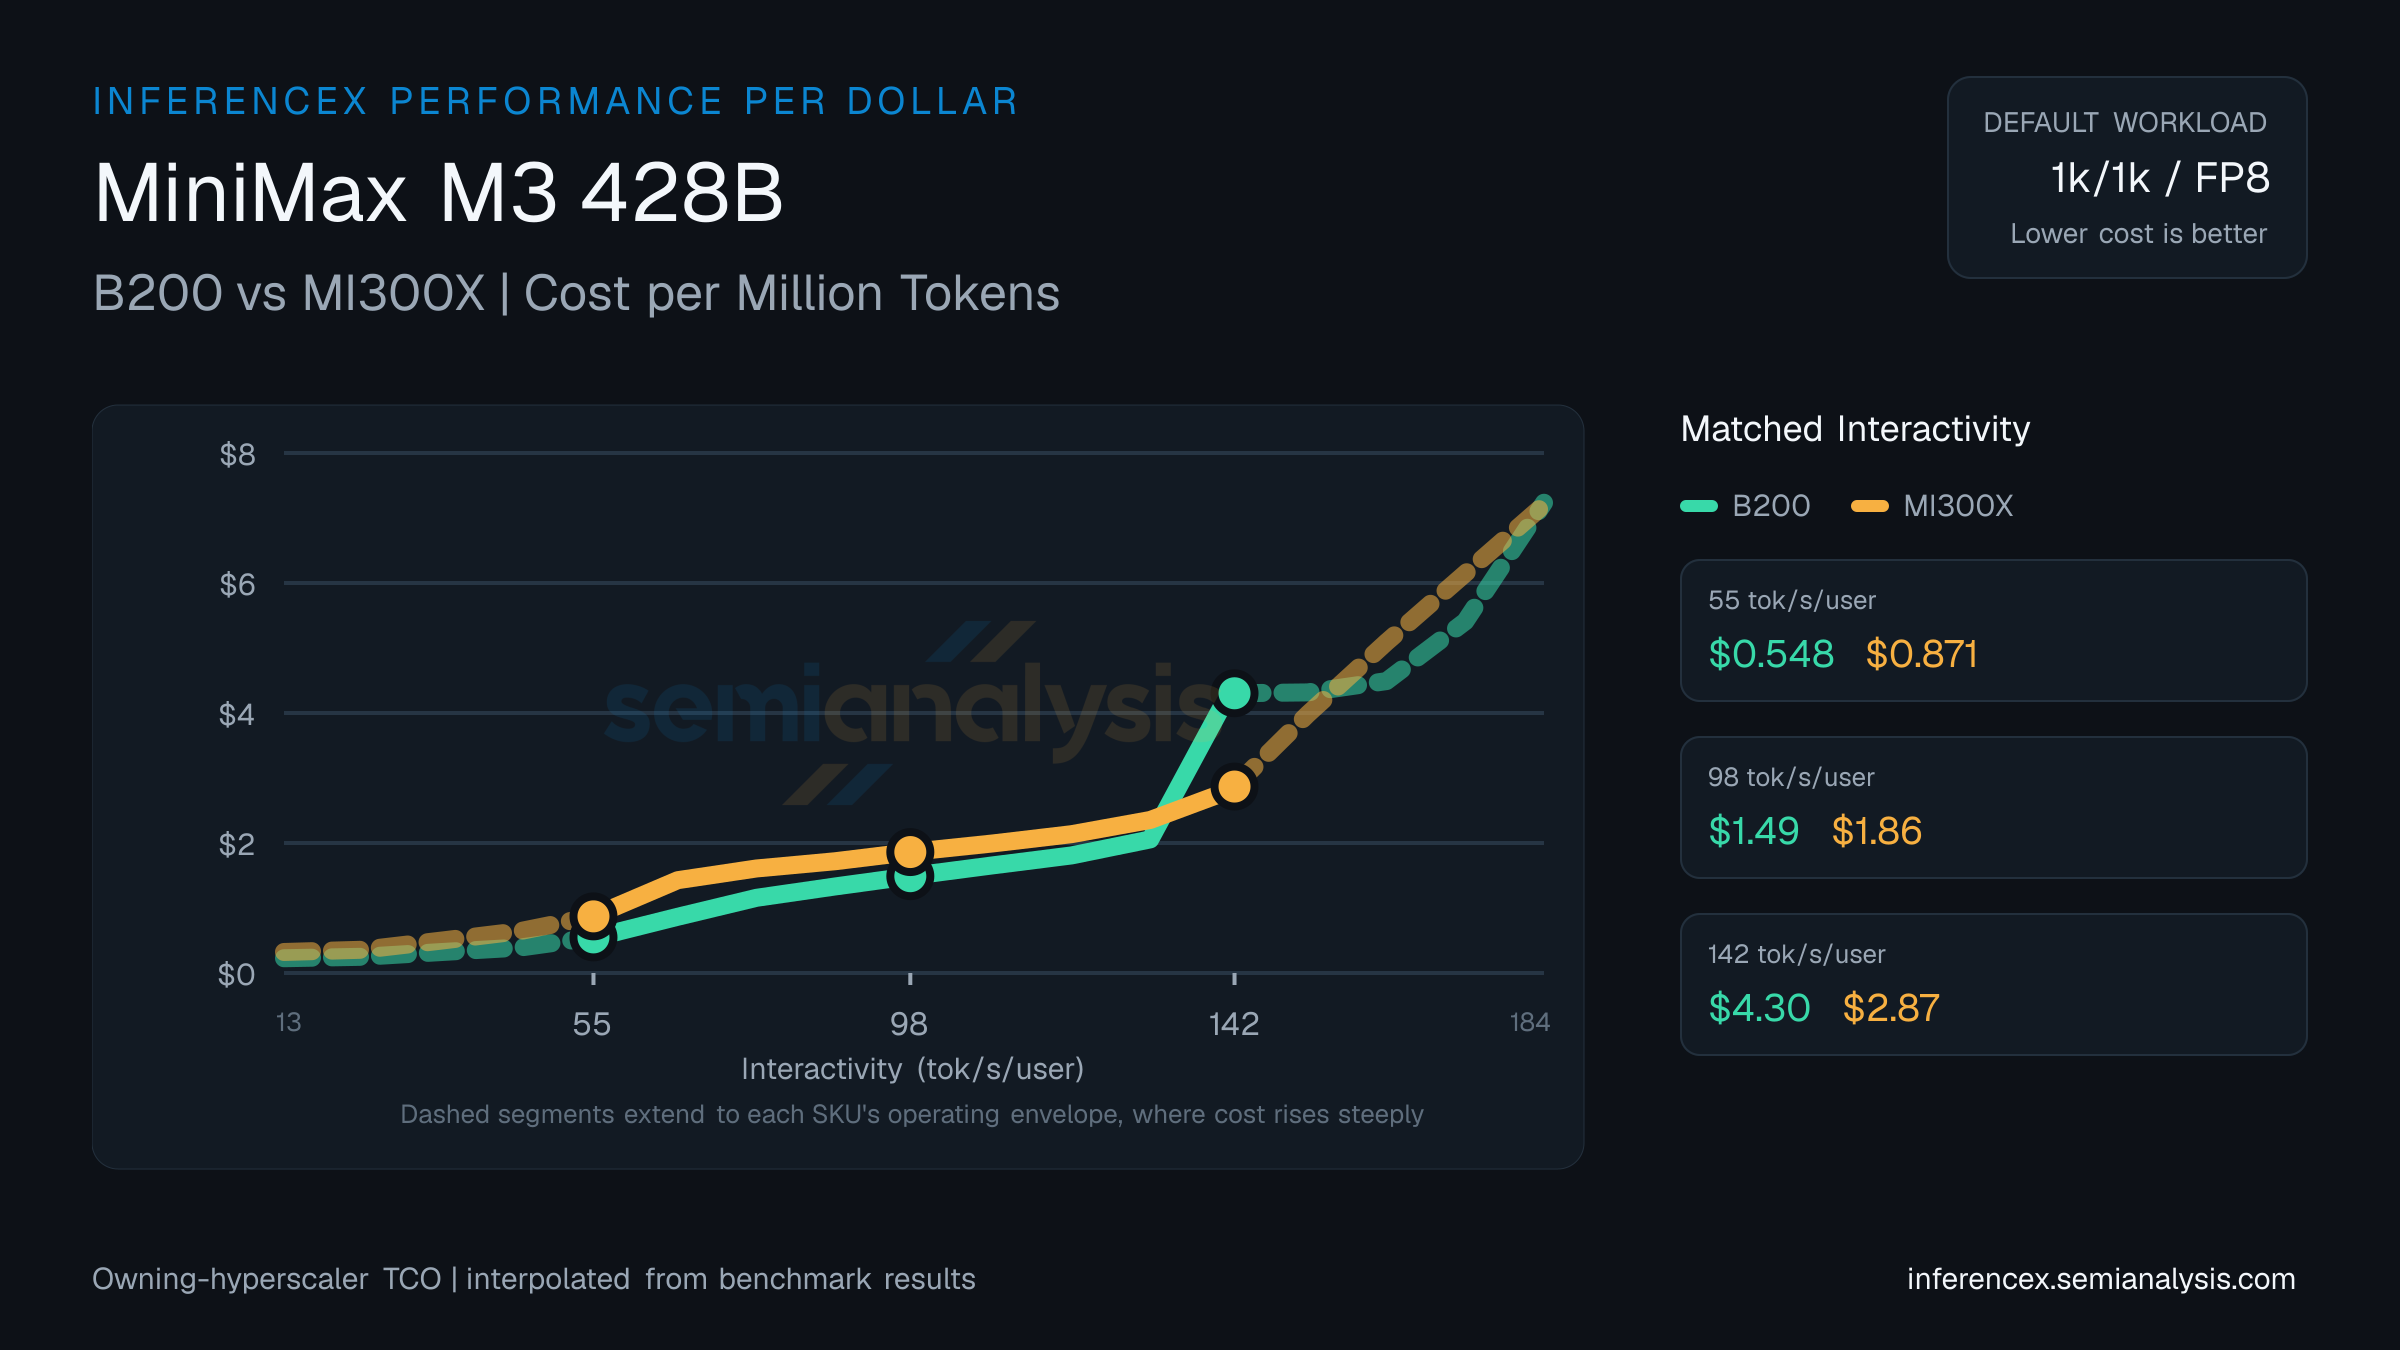
Cost per million tokens of B200 (NVIDIA Blackwell) versus MI300X (AMD CDNA 3) on MiniMax M3 428B. Owning-hyperscaler TCO normalized by output tokens — performance per dollar across LLM workloads. Pick the more cost-efficient SKU at every target interactivity level. Use the chart controls below to switch sequences, precisions, and metrics — same interactions as the main inference chart.
Near the low end of the 13–149 tok/s/user interactivity band — at 47 tok/s/user — B200 runs $0.16 per million tokens on MiniMax M3 428B while MI300X runs $0.59. B200 is the cheaper choice by 263%.
On MiniMax M3 428B at 81 tok/s/user, the per-million math comes out to $0.32 for B200 and $1.53 for MI300X; B200 delivers 380% more output per dollar.
At 115 tok/s/user on MiniMax M3 428B, B200 costs $0.41 per million tokens; MI300X costs $2.14. B200 is 424% more cost-efficient at this operating point. (Numbers reflect the default 1k/1k · fp8 selection for this URL — table and chart below update if you change sequence, precision, or model in the controls.)
GPU pricing (owning hyperscaler): B200 $1.95/GPU/hr · MI300X $1.12/GPU/hr. Source: SemiAnalysis Market August 2025 Pricing Surveys & AI Cloud TCO Model.
| Metric | Interactivity (tok/s/user) | Interactivity (tok/s/user) | Interactivity (tok/s/user) |
|---|---|---|---|
| Dollar per Million Tokens | B200:$0.162MI300X:$0.590 | B200:$0.319MI300X:$1.534 | B200:$0.409MI300X:$2.145 |
| Concurrency | B200:~175MI300X:~47 | B200:~63MI300X:~11 | B200:~28MI300X:~5 |
Inference Performance
Inference performance metrics across different models, hardware configurations, and serving parameters.