MiniMax M2.5/M2.7 — B300 vs H200 Performance per Dollar
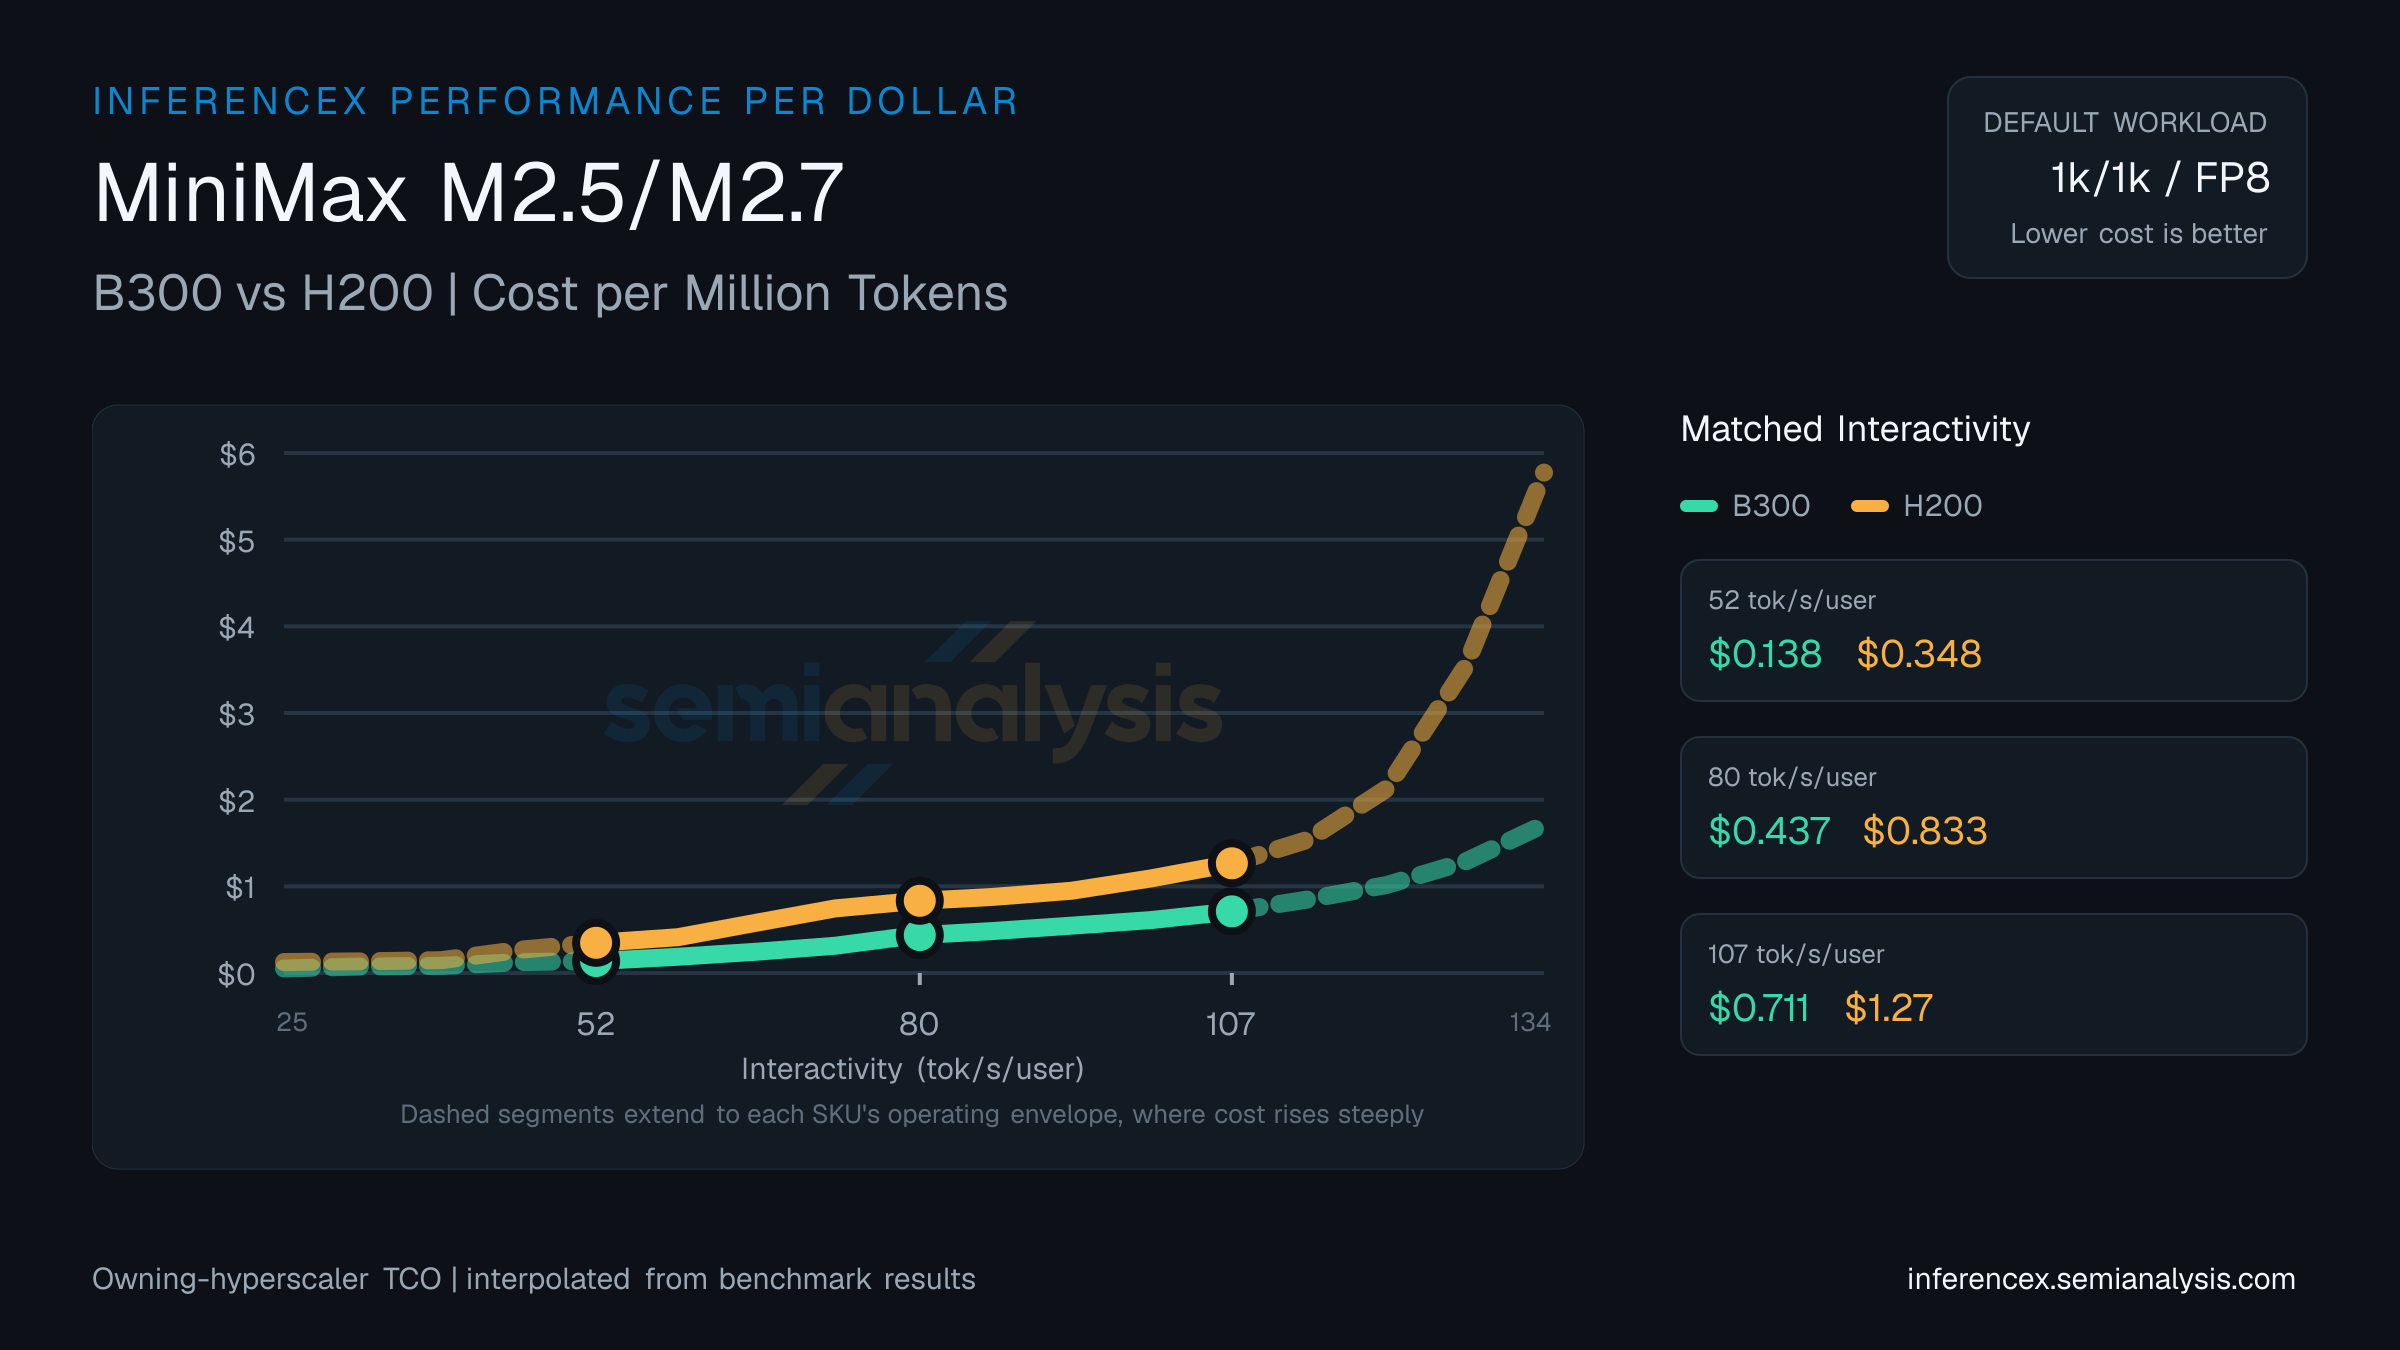
Cost per million tokens of B300 (NVIDIA Blackwell) versus H200 (NVIDIA Hopper) on MiniMax M2.5/M2.7. Owning-hyperscaler TCO normalized by output tokens — performance per dollar across LLM workloads. Pick the more cost-efficient SKU at every target interactivity level. Use the chart controls below to switch sequences, precisions, and metrics — same interactions as the main inference chart.
B300: $0.14 per million tokens. H200: $0.35. Both at 52 tok/s/user on MiniMax M2.5/M2.7, with B300 152% cheaper.
Around the middle of the 25–134 tok/s/user interactivity band — at 80 tok/s/user — B300 runs $0.44 per million tokens on MiniMax M2.5/M2.7 while H200 runs $0.83. B300 is the cheaper choice by 90%.
On MiniMax M2.5/M2.7 at 107 tok/s/user, the per-million math comes out to $0.71 for B300 and $1.27 for H200; B300 delivers 78% more output per dollar. (Numbers reflect the default 1k/1k · fp8 selection for this URL — table and chart below update if you change sequence, precision, or model in the controls.)
GPU pricing (owning hyperscaler): B300 $2.34/GPU/hr · H200 $1.41/GPU/hr. Source: SemiAnalysis Market August 2025 Pricing Surveys & AI Cloud TCO Model.
| Metric | Interactivity (tok/s/user) | Interactivity (tok/s/user) | Interactivity (tok/s/user) |
|---|---|---|---|
| Dollar per Million Tokens | B300:$0.138H200:$0.348 | B300:$0.437H200:$0.833 | B300:$0.711H200:$1.266 |
| Concurrency | B300:~478H200:~64 | B300:~42H200:~19 | B300:~17H200:~6 |
Inference Performance
Inference performance metrics across different models, hardware configurations, and serving parameters.