gpt-oss 120B — B200 vs H200 Performance per Dollar
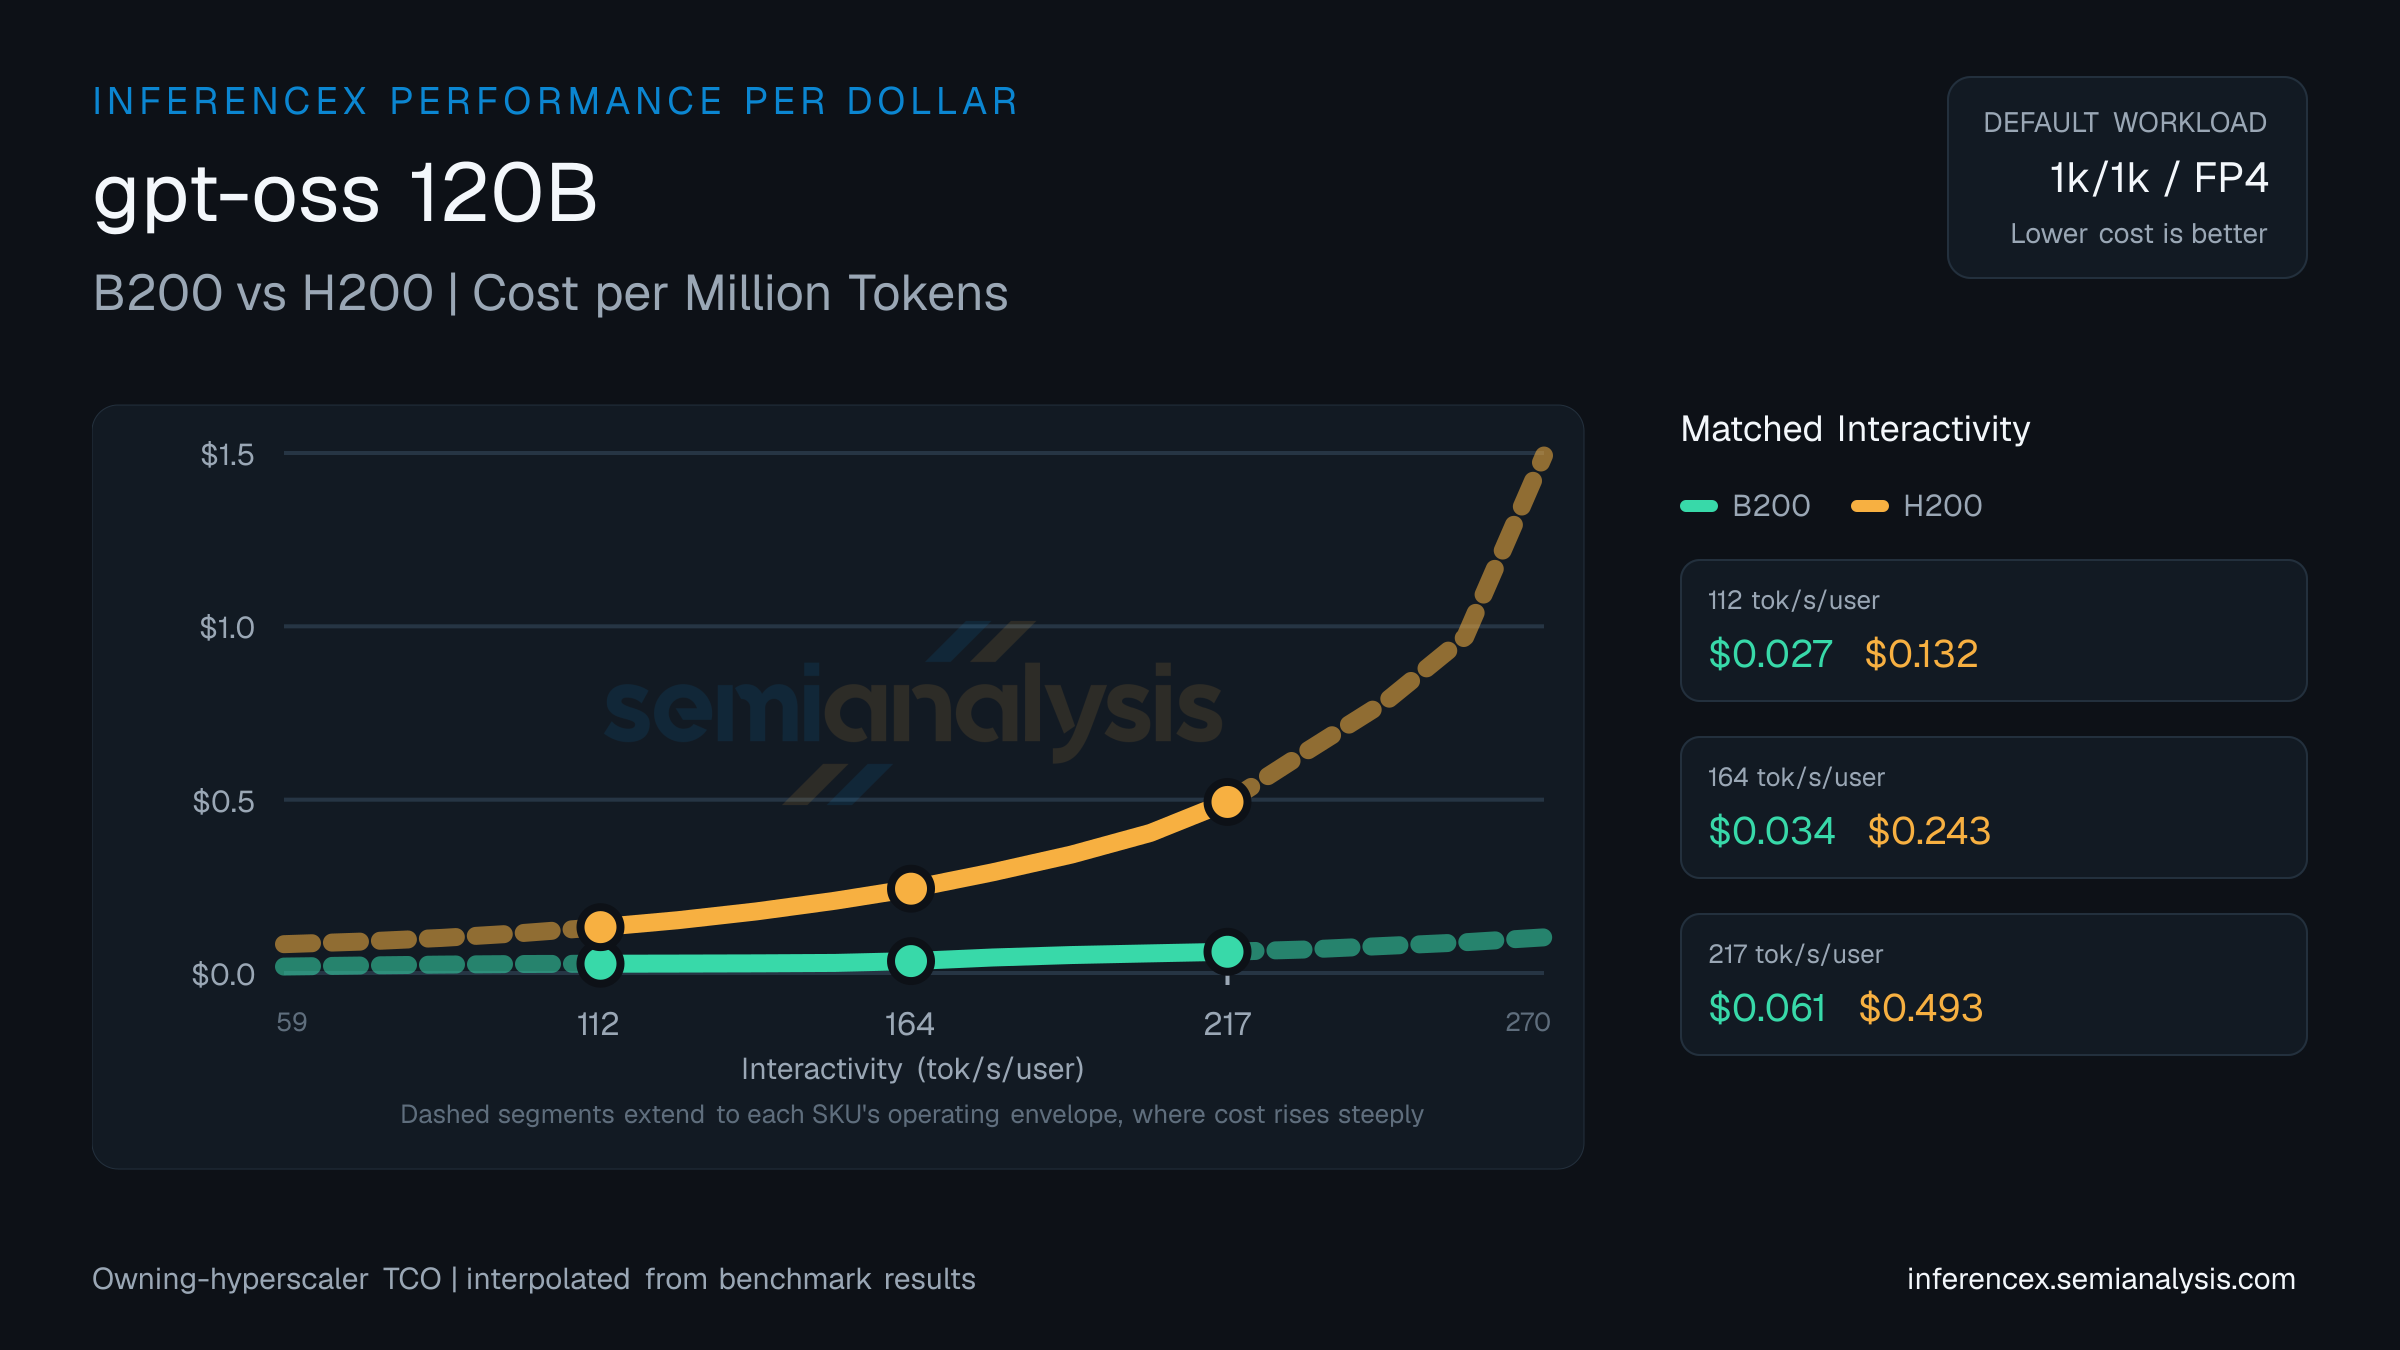
Cost per million tokens of B200 (NVIDIA Blackwell) versus H200 (NVIDIA Hopper) on gpt-oss 120B. Owning-hyperscaler TCO normalized by output tokens — performance per dollar across LLM workloads. Pick the more cost-efficient SKU at every target interactivity level. Use the chart controls below to switch sequences, precisions, and metrics — same interactions as the main inference chart.
Push gpt-oss 120B to 112 tok/s/user and B200 lands at $0.03 per million tokens against H200's $0.13 — B200 pulls ahead by 395%.
B200: $0.03 per million tokens. H200: $0.24. Both at 164 tok/s/user on gpt-oss 120B, with B200 609% cheaper.
Toward the upper edge of the 59–270 tok/s/user interactivity band — at 217 tok/s/user — B200 runs $0.06 per million tokens on gpt-oss 120B while H200 runs $0.49. B200 is the cheaper choice by 706%. (Numbers reflect the default 1k/1k · fp4 selection for this URL — table and chart below update if you change sequence, precision, or model in the controls.)
GPU pricing (owning hyperscaler): B200 $1.95/GPU/hr · H200 $1.41/GPU/hr. Source: SemiAnalysis Market August 2025 Pricing Surveys & AI Cloud TCO Model.
| Metric | Interactivity (tok/s/user) | Interactivity (tok/s/user) | Interactivity (tok/s/user) |
|---|---|---|---|
| Dollar per Million Tokens | B200:$0.027H200:$0.132 | B200:$0.034H200:$0.243 | B200:$0.061H200:$0.493 |
| Concurrency | B200:~230H200:~64 | B200:~98H200:~45 | B200:~64H200:~7 |
Inference Performance
Inference performance metrics across different models, hardware configurations, and serving parameters.