AgentX tutorial
Exploring Agentic Workloads: Detailed Telemetry
A single AgentX datapoint represents thousands of requests across growing conversations, subagents, warmup periods, cache states, and dynamically changing in-flight load. This is how to open one up.
- per-point telemetry charts
- 11
- views per point
- 3
- replay stages
- 2
- curve per model, SKU, and engine
- 1
AgentX required more than a new benchmark harness and dataset. We also spent some time rebuilding parts of the InferenceX visualization to make agentic results easier to explore and digest. A single point on a Pareto curve can hide a lot of useful information, so every point on an AgentX chart is now a doorway into the run behind it.
This tutorial walks through what that doorway leads to: how the curves themselves are constructed, what the point tooltip exposes, the eleven per-point telemetry charts on the detail page, the request timeline, and the per-conversation flamegraph on the AgentX dataset pages.
Why a single point is not enough
A fixed-sequence benchmark point is a summary of a homogeneous workload: every request has the same input and output length, so an aggregate throughput number describes the run fairly. An AgentX point is not that. It aggregates thousands of requests whose input lengths grow as conversations extend, whose subagents arrive in bursts, and whose cache state changes throughout the replay.
Two points with nearly identical aggregate throughput can therefore behave very differently under the hood — one sustaining a steady prefix-cache hit rate, the other repeatedly evicting and recomputing. Per-point telemetry is what makes that difference visible.
One curve per model, SKU, and inference engine
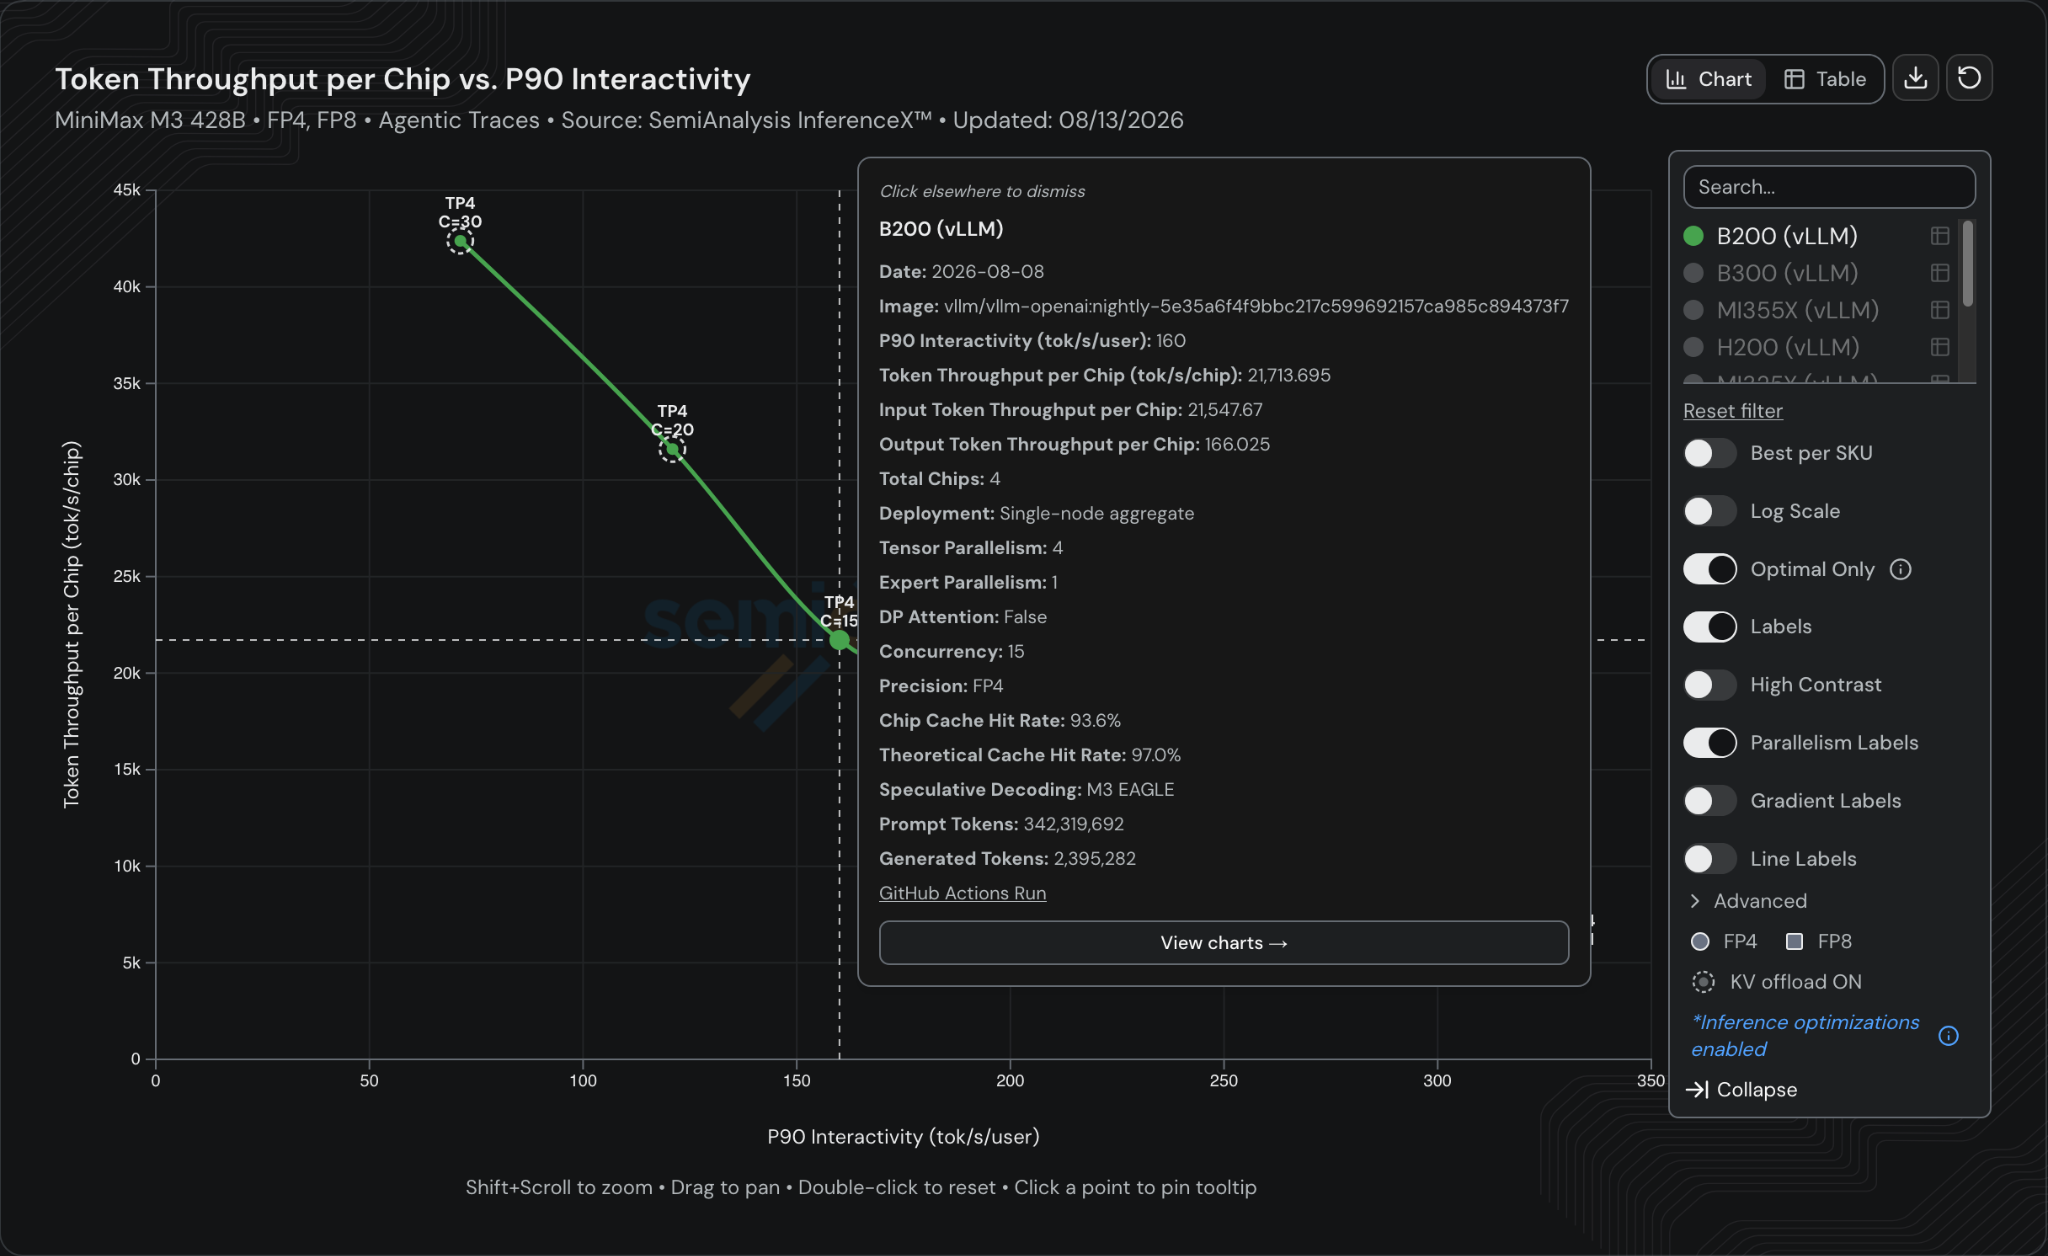
One of our major changes is how we construct the curves themselves. In previous versions of InferenceX, configurations with speculative decoding enabled and disabled were often displayed as separate curves. We are now moving away from this approach. The frontend combines allowed inference optimizations and displays the best available curve for each model, SKU, and inference engine combination.
Because of this, individual points along a single curve may use different optimization techniques and configurations, including speculative decoding, disaggregation, or KV cache offload. Our goal is to show the best production performance available from each hardware and software stack, rather than creating a separate curve for every possible combination of optimizations.
We still expose the underlying configuration and provenance for every point. Clicking a point shows a tooltip with a detailed view showing exactly which configuration produced it, along with the run metadata, links to the publicly viewable CI provenance, and AgentX specific statistics. From there, the "View charts" link opens the full point-detail page.
The point-detail page
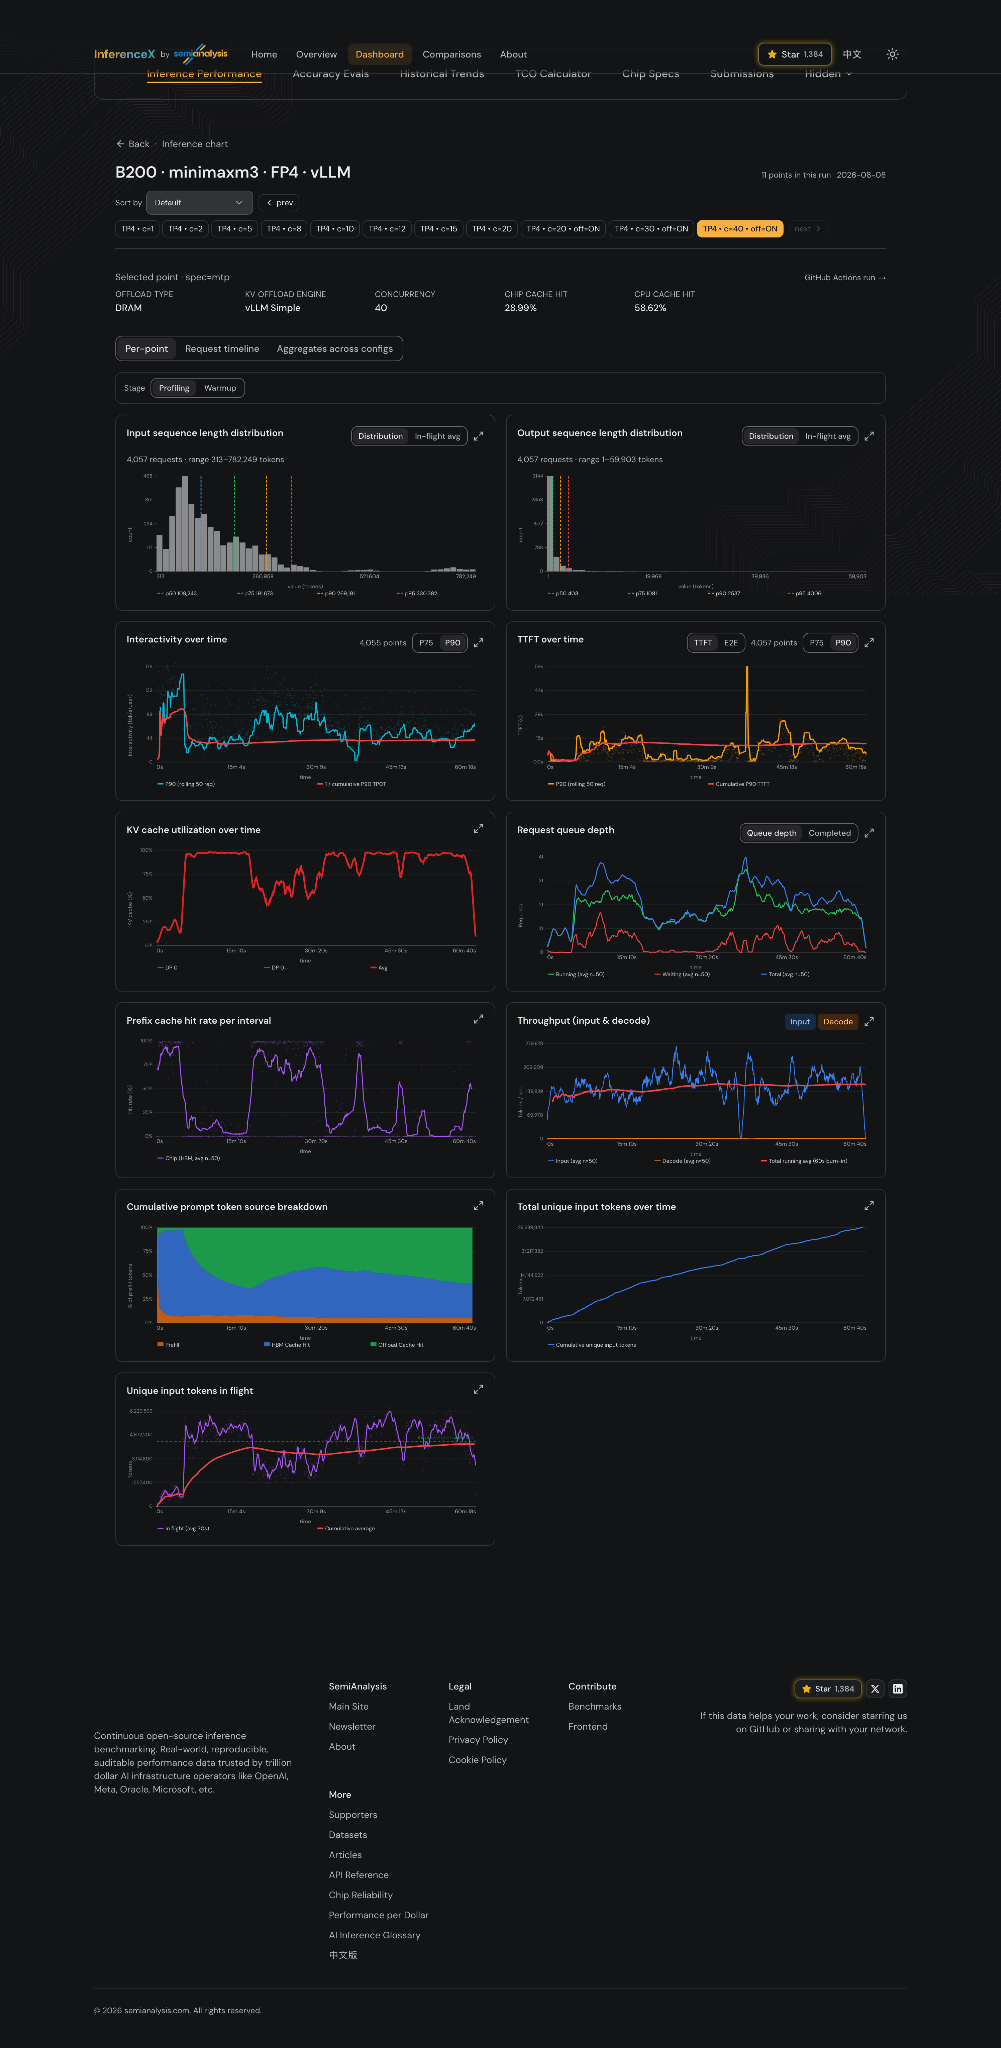
The detailed point view provides a much deeper look into the selected AgentX run. These metrics make it easier to understand why two points with similar aggregate throughput may behave differently throughout the replay.
The page also separates warmup and profiling data. Readers can switch between the two phases to inspect how the system behaves while its cache state is being established and during the profiling period used for the benchmark run. Reported results cover the profiling window only, so the warmup stage is where cache-fill behavior — and the cost of establishing it — becomes visible.
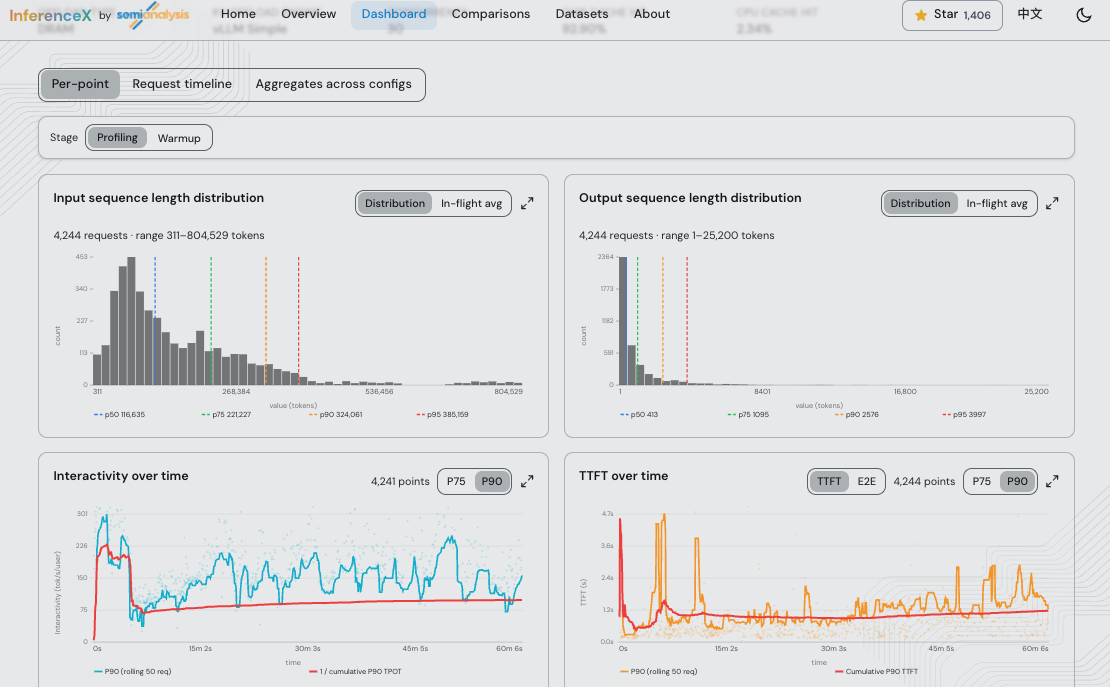
- Input and output sequence length distributions, as a histogram or as an in-flight average.
- Interactivity over time, at P75 or P90, against its cumulative value.
- Time to first token (TTFT) over time, switchable between TTFT and end-to-end latency.
- KV cache utilization over time, broken out by engine where more than one reports it.
- Request queue depth, alongside the count of requests completed.
- Prefix cache hit rate per interval.
- Input and decode throughput.
- Cumulative prompt-token source breakdown — how much of the prompt came from cache versus recomputation.
- Total unique input tokens over time, and unique input tokens in flight against the KV cache pool size.
Reading KV cache offload points
Points using KV cache offload are surrounded by an additional dotted circle on the main chart, which is used to distinguish points with KV offload enabled. When one of these points is selected, the detail page shows the offload type, KV offload engine, chip cache-hit rate, and CPU cache-hit rate.
This makes it possible to see where KV offload contributes to the best curve without creating a separate curve for every offload configuration — the same principle behind combining optimizations into a single curve, applied to the one optimization whose effect is easiest to miss.
The request timeline
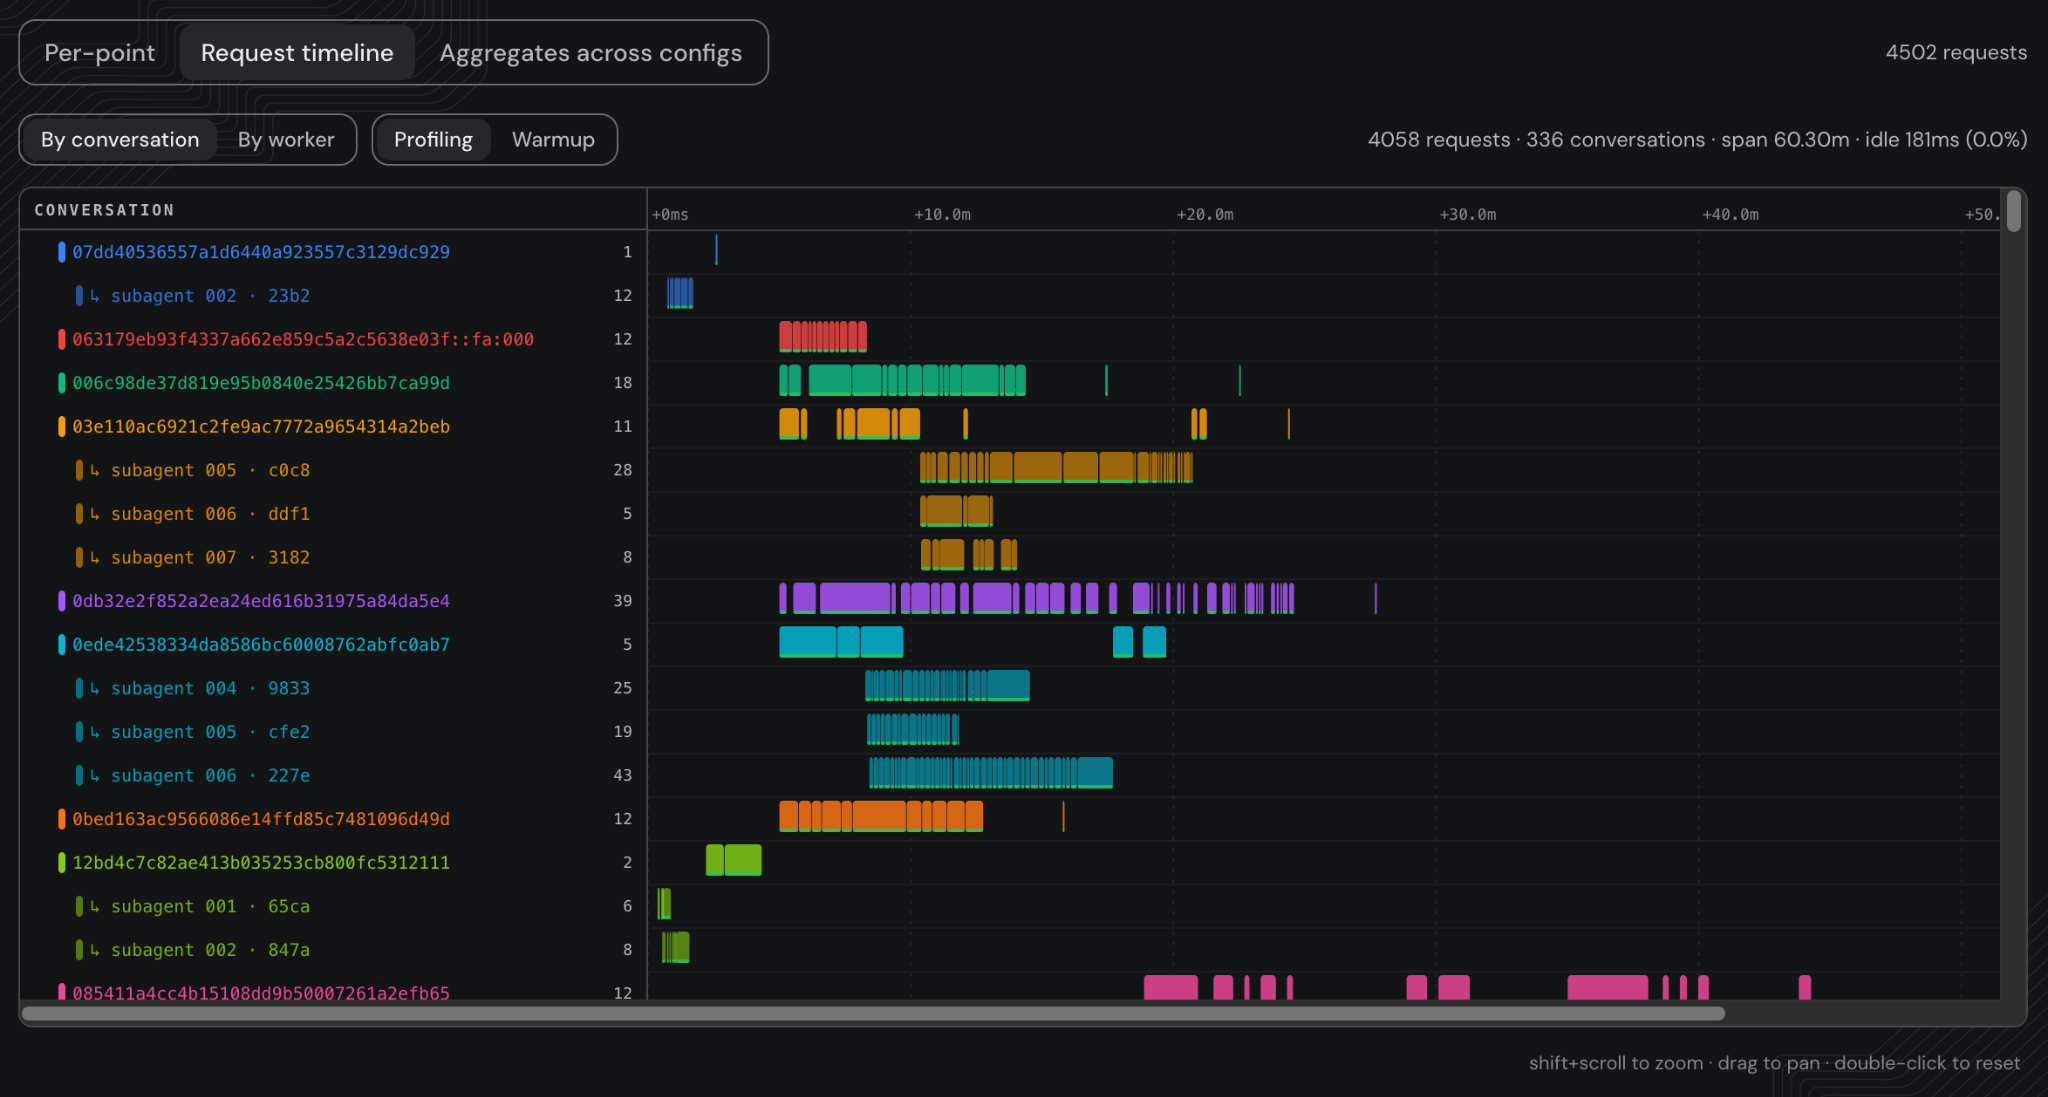
Another new feature is the request timeline. This view shows the individual requests replayed during a selected AgentX run and can be organized either by conversation or by worker. The conversation view groups subagents underneath their corresponding root conversation, making it easy to see when conversations and subagents overlap. Warmup and profiling requests can also still be viewed separately.
Each request in the timeline is clickable and links directly to the corresponding conversation and turns on the InferenceX datasets page. This allows readers to move from an aggregate point on the Pareto curve to the exact anonymized request that was replayed.
The per-conversation flamegraph
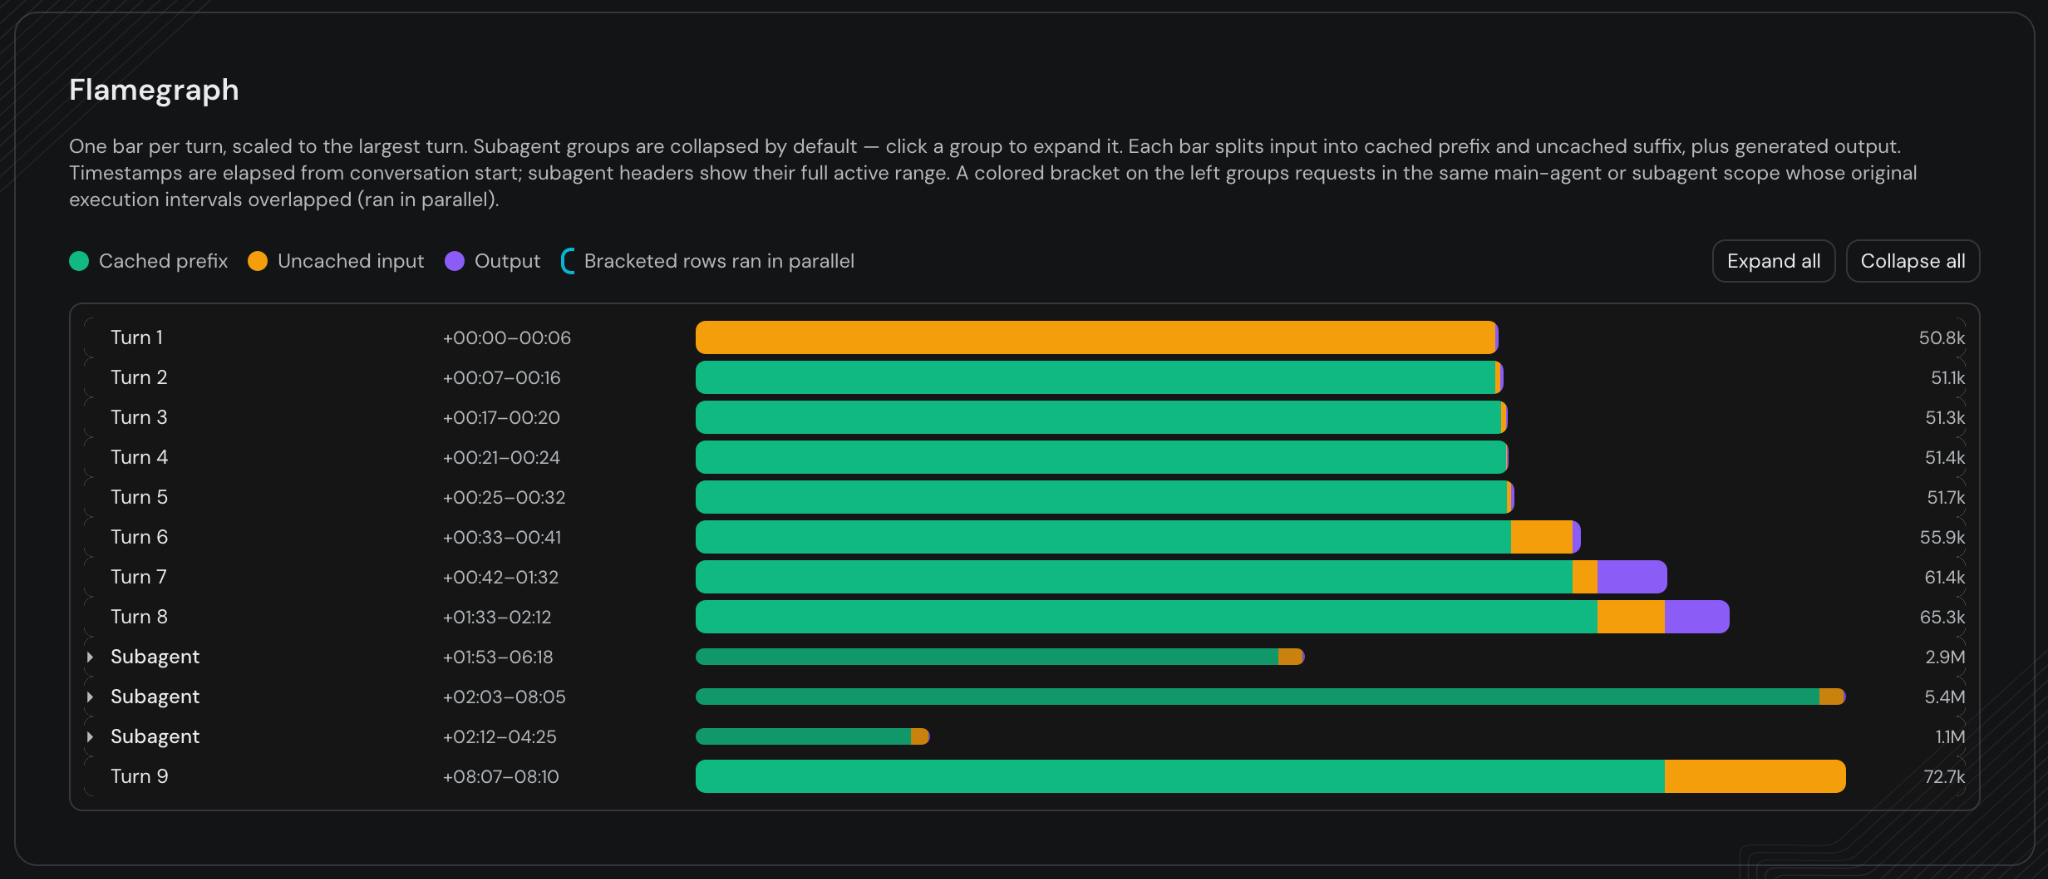
The AgentX page also includes a flamegraph for visualizing the structure of an individual conversation. Each bar represents one turn and is scaled relative to the largest turn in that conversation. The bar is divided into cached prefix tokens, uncached input tokens, and generated output tokens.
This gives a visual representation of how the context grows throughout a conversation and how much of each request can be reused from KV cache. Subagent groups are collapsed by default and expand on click; a colored bracket on the left groups requests in the same main-agent or subagent scope whose original execution intervals overlapped, so parallel work reads as parallel.