
AgentX industry impact · Router and orchestration
NVIDIA Dynamo
A good part of the NVIDIA submission uses the Dynamo inference orchestration and router system. Its AgentX series shows that the distributed serving layer can become the bottleneck once engine kernels improve: the router’s work is proportional to the number and length of live prefixes rather than to the number of tokens generated, so many long, overlapping, long-lived sessions load it in a way fixed-shape traffic never does.
- median output throughput at concurrency 512
- +22.2%
- AgentX replay time with request leases (vLLM)
- −23.71%
- frontend requests per second
- 932 → 1,133
The cost of each routing decision
The first series of pull requests reduced the cost of each routing decision: less work on the lookup hot path, no redundant suffix invalidation, and finally batched KV matching, registration, ownership, and terminal dereferences, which reported a 22.2% median output-throughput gain at concurrency 512. Batching helps here for the same reason it helps in an engine: the per-item overhead was dominating the item.
Upstream pull requests
How ownership is represented
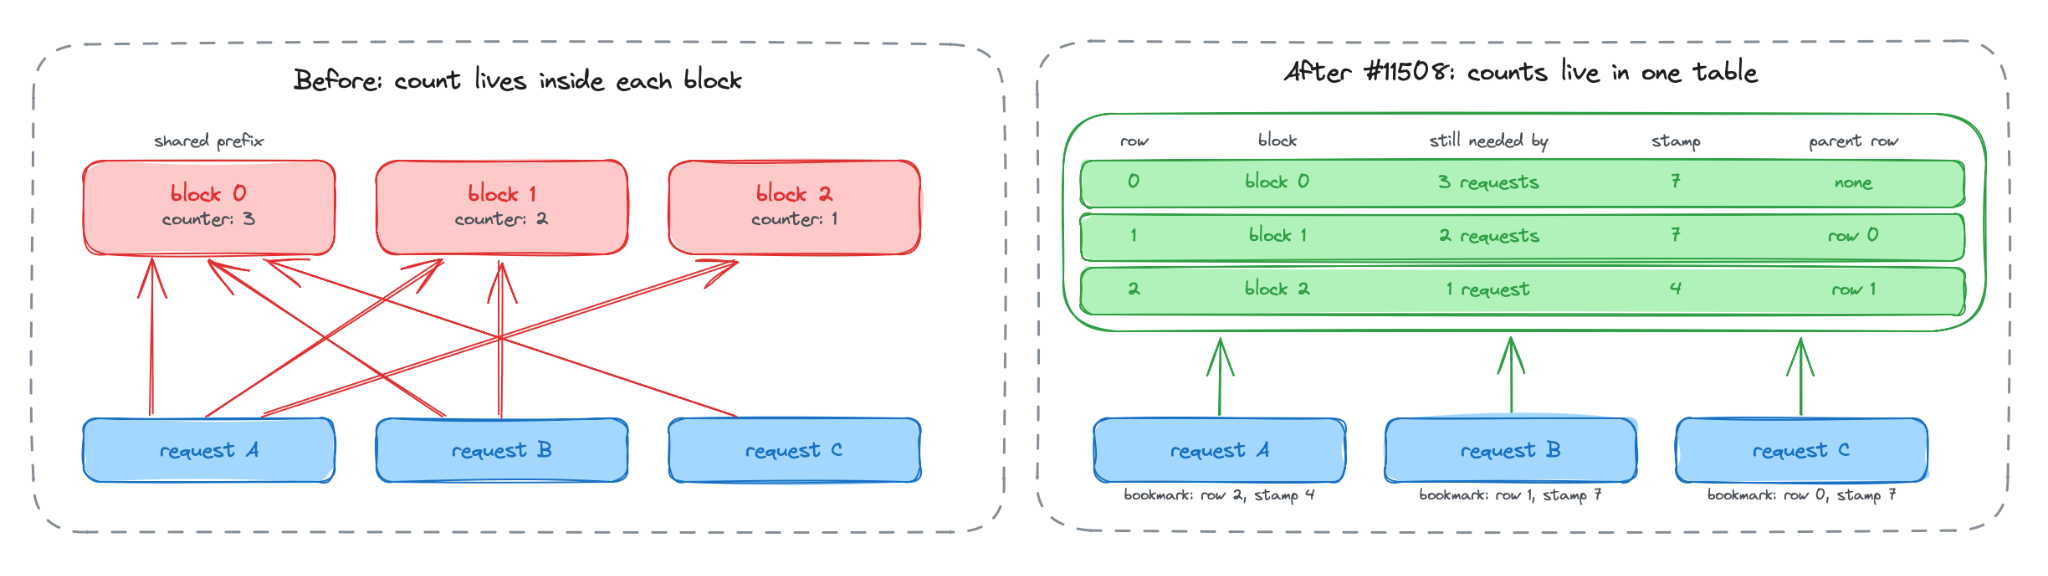
The second series changed how ownership is represented, which is the harder problem underneath. Every cached block needs to be attributed to the requests relying on it, so it is not freed while still in use and not pinned after everyone has finished. With thousands of concurrent sessions sharing overlapping prefixes, the bookkeeping itself becomes significant.
Dynamo moved from shared block chains to arena-level ownership counts and finally to backend-specific request leases, each step coarsening the unit being tracked. The lease design reduced AgentX replay time by 23.71% for the vLLM backend and 22.02% for SGLang, and lowered peak memory at the same time — a sign that the previous representation was the problem rather than the traffic.
Upstream pull requests
Router state that used to be small
Further router profiles removed costs with the same shape, where a periodic sweep or a full recomputation had been acceptable only because live state used to be small. Bucketed expiry pruning replaced a scan proportional to everything tracked and improved high-churn AgentX throughput by 13.7%. Delta-only suffix cleanup processes only what changed and absorbed about 28 times as many store and remove events in the same window. Compressed prompt paths cut frontend CPU by 35.3% and materially improved tail time to first token, which matters because prompts in this workload are long and largely repeated. Overload state is now tracked incrementally rather than recomputed.
One routing change is a deliberate trade rather than a pure win. Dynamo can now charge active decode requests in its routing score, so a worker already committed to long-running decodes looks more expensive than its queue depth alone suggests. That improved median AgentX latency at a small throughput cost in the reported tuning point — the kind of choice that only becomes visible when requests occupy a worker for a long time.
Upstream pull requests
The request plane
The request plane was optimized next, because an agentic trace does not send one request and one response. It sends many related requests carrying largely identical prompts, and streams every token back as its own frame, so serialization and copying are paid per turn and per token rather than once. Switching to MessagePack request payloads improved throughput by 8.1% and reduced average time to first token by 9.7% in its AgentX test, and direct Python transcoding removed an intermediate value tree from that path entirely.
What followed is a sequence of changes that all remove a copy rather than speed one up: not copying MessagePack event payloads, not copying received ZeroMQ frames, and not paying full inter-token-latency metrics overhead on every token. The chat streaming hot path was shortened for the same reason. Individually these are unremarkable; multiplied by every streamed token of every concurrent session, they determine how many requests per second a frontend can sustain.
Costs that had nothing to do with moving data
High-concurrency profiling then found costs that had nothing to do with moving data. Static logging filters removed a shared span-matcher lock — a contention point rather than a volume problem — and raised reported frontend throughput from 932 to 1,133 requests per second. Simpler positional radix buckets reduced peak memory in the mocker by 5.51 GiB in a 32-worker run.
An open change flushes detokenization metrics once per response rather than updating cumulative counters on every streamed chunk, approximately halving frontend CPU time in its matched diagnostic profile. That last one is the clearest example of the category: the instrumentation was cheap per call and ruinous at one call per token.
Upstream pull requests
Other projects
Inference engine
vLLM
Hybrid-attention prefix retention, CPU KV offload for hybrid models, and a narrowed store and load path.
Read the optimizations →Inference engine
SGLang
Sliding-window allocation, HiCache hybrid offload, runtime-scalar context length, and cache-aware DP routing.
Read the optimizations →Inference engine
TensorRT-LLM
Boundary-aware incremental tokenization, disaggregated KV descriptor coalescing, and scheduler-lifetime fixes.
Read the optimizations →Inference engine
AMD ATOM
Sparse checkpoint retention, recurrent-state checkpoints, CPU offload ownership, and long-prefill parallelism.
Read the optimizations →Kernels
ROCm AITER
Context-parallel process groups, 64-bit addressing for large cache pools, and persistent MLA decode kernels.
Read the optimizations →KV-cache layer
LMCache
Chunked external-cache loading, hybrid-group storage, AMD Instinct enablement, and DCP-aware offload.
Read the optimizations →Transfer engine
Mooncake
GPU-direct RDMA on ROCm through HIP dmabuf, plus a published ROCm wheel and release path.
Read the optimizations →